Customer service KPI play a crucial role in measuring and evaluating the performance of customer service teams. KPIs provide valuable insights into the effectiveness of customer service processes, agent performance, and overall customer satisfaction. By tracking these metrics, organizations can identify areas for improvement, make data-driven decisions, and enhance the quality of their customer service operations.
In this article, we will explore 20 essential customer service KPI that can be used to measure team performance. We will dive into each metric’s meaning, provide real-world examples, and discuss how to calculate and interpret them effectively. Additionally, we will share templates that can simplify the tracking and reporting of KPIs, and we will highlight the importance of utilizing a comprehensive dashboard to visualize and monitor these metrics.
By understanding and implementing these customer service KPIs, organizations can gain a deeper understanding of their team’s performance and identify opportunities to optimize customer experiences. Whether you are a customer service manager looking to evaluate your team’s effectiveness or a business owner aiming to enhance customer satisfaction, this article will serve as a valuable resource for measuring and improving customer service team performance.
Table of Contents
Understanding Customer Service KPI
Customer service Key Performance Indicators (KPIs) are specific measurable metrics that organizations use to assess the performance and effectiveness of their customer service teams. These metrics provide valuable insights into various aspects of customer service operations, helping organizations track progress, identify areas for improvement, and make data-driven decisions to enhance customer satisfaction.
Definition and significance of customer service KPIs:
- Customer service KPIs are quantifiable measurements that reflect the performance and success of customer service operations.
- These metrics are directly linked to key business objectives, such as customer satisfaction, retention, and loyalty.
- KPIs provide a clear understanding of how well the customer service team is meeting customer needs and expectations.
2. How KPIs help assess team performance and improve customer satisfaction:
- Customer service KPI enable organizations to track and evaluate team performance against specific goals and benchmarks.
- These metrics provide insights into the efficiency, effectiveness, and quality of customer service interactions.
- KPIs help identify bottlenecks, areas of improvement, and training needs within the customer service team.
- By measuring and analyzing KPIs, organizations can implement targeted strategies to enhance customer satisfaction, loyalty, and overall customer experience.
By monitoring customer service KPI, organizations can identify trends, patterns, and areas of improvement. For example, metrics like Average Response Time and First Response Time help measure the team’s responsiveness and efficiency in addressing customer inquiries. Customer Satisfaction Score (CSAT), Net Promoter Score (NPS), and Customer Effort Score (CES) provide valuable insights into customer satisfaction levels and help identify opportunities to enhance service quality.
Related Article : What is a Key Performance Indicator (KPI)? Meaning, Templates, Examples
Key Customer Service KPI
A. Response Time Metrics
1. Average Response Time
Average Response Time is a crucial customer service KPI that measures the time it takes for a customer’s initial inquiry or request to receive a response from a customer service representative. It provides insights into the speed and efficiency of the customer service team in addressing customer concerns.
Explanation:
- Average Response Time is calculated by summing up the response times for all inquiries received during a specific period (e.g., a day, a week) and dividing it by the total number of inquiries.
- A lower average response time indicates a more prompt and responsive customer service team.
- This KPI helps assess how quickly the team can acknowledge and provide initial assistance to customers, setting the tone for a positive customer experience.
- Average Response Time is commonly used in various customer service channels, including email, live chat, social media, and ticketing systems.
Why it matters:
- Fast response times are essential for customer satisfaction, as customers expect timely resolutions to their inquiries or problems.
- A lengthy response time can lead to customer frustration, dissatisfaction, and even customer churn.
- Monitoring and improving Average Response Time can enhance customer experiences, increase customer loyalty, and positively impact overall customer satisfaction scores.
Best practices:
- Set target response time goals based on industry benchmarks and customer expectations.
- Use automation tools and intelligent routing systems to prioritize and route inquiries efficiently.
- Regularly analyze response time data to identify trends, peak hours, and areas requiring improvement.
- Provide training and resources to empower customer service representatives to respond quickly and effectively.
Remember, while Average Response Time is an essential metric, it should be considered alongside other customer service KPI to gain a comprehensive understanding of team performance and customer satisfaction levels.
2. First Response Time
First Response Time is a critical customer service KPI that measures the duration between a customer’s initial inquiry or request and the first response provided by a customer service representative. It evaluates the speed and efficiency of the team in acknowledging and addressing customer concerns promptly.
Explanation:
- First Response Time is calculated by measuring the time from when a customer submits their inquiry to when the customer service team provides the first meaningful response.
- It is typically tracked separately for each customer service channel, such as email, live chat, or phone.
- A lower first response time indicates a more proactive and responsive customer service team.
- This KPI focuses on the crucial initial interaction with the customer, setting the tone for the overall customer experience.
- It is important to note that First Response Time does not necessarily indicate issue resolution but highlights the team’s commitment to acknowledging customer inquiries promptly.
Why it matters:
- First Response Time directly impacts customer satisfaction and perception of service quality.
- Customers appreciate receiving timely acknowledgement and knowing that their concerns are being addressed promptly.
- Longer first response times can lead to increased customer frustration, decreased satisfaction, and potential negative word-of-mouth.
- Monitoring and improving First Response Time can help organizations enhance customer experiences, build trust, and foster loyalty.
Best practices:
- Set specific First Response Time targets based on customer expectations and industry standards.
- Utilize automation, chatbots, or canned responses to acknowledge and triage customer inquiries promptly.
- Implement proper queuing and routing systems to distribute workload effectively among customer service representatives.
- Continuously track and analyze First Response Time data to identify trends, bottlenecks, and areas for improvement.
While First Response Time is important, it should be assessed in conjunction with other customer service KPI to gain a comprehensive understanding of team performance and customer satisfaction levels.
3. Average Handle Time
Average Handle Time (AHT) is a customer service KPI that measures the average duration it takes for a customer service representative to handle a customer interaction from start to finish. It evaluates the efficiency and productivity of the team in resolving customer issues or inquiries.
Explanation:
- Average Handle Time is calculated by summing up the total handling time of all customer interactions (e.g., phone calls, chats, emails) during a specific period and dividing it by the total number of interactions.
- It includes the time spent actively engaged with the customer, including gathering information, providing assistance, and resolving the customer’s query or concern.
- A lower average handle time indicates higher efficiency in addressing customer needs.
- It is important to note that while AHT focuses on efficiency, it should not compromise the quality of customer service or leave customers feeling rushed or underserved.
Why it matters:
- AHT is a critical metric for assessing operational efficiency and resource allocation within the customer service team.
- It helps identify bottlenecks, areas for process improvement, and potential training needs.
- Optimizing AHT can lead to cost savings, increased productivity, and improved customer satisfaction.
Best practices:
- Provide comprehensive training to customer service representatives to ensure they have the knowledge and skills to handle customer interactions efficiently.
- Implement effective knowledge management systems and tools to enable quick access to information during customer interactions.
- Encourage representatives to actively listen to customers, ask clarifying questions, and provide accurate and concise responses.
- Continuously monitor and analyze AHT data to identify outliers, trends, and opportunities for process optimization.
It is important to balance AHT with other customer service KPI such as customer satisfaction metrics. While a low AHT may indicate efficiency, it should not come at the expense of customer satisfaction or the quality of service provided.
4. Resolution Time
Resolution Time is a customer service KPI that measures the duration it takes to fully resolve a customer’s issue or inquiry. It assesses the effectiveness and efficiency of the customer service team in providing satisfactory solutions to customers.
Explanation:
- Resolution Time is calculated by measuring the time from when a customer’s issue or inquiry is first reported to when it is completely resolved.
- It includes the entire process of investigating, troubleshooting, and finding a solution or providing a satisfactory response to the customer.
- Resolution Time can vary depending on the complexity of the issue, the availability of resources, and the level of cooperation from the customer.
- A lower resolution time indicates a quicker and more effective resolution of customer issues.
Why it matters:
- Resolution Time is a critical metric for customer satisfaction, as customers want their problems resolved promptly.
- Longer resolution times can lead to customer dissatisfaction, frustration, and potential negative impacts on customer loyalty.
- Monitoring and improving Resolution Time can help organizations deliver better customer experiences, increase customer satisfaction, and reduce customer churn.
Best practices:
- Provide comprehensive training to customer service representatives to ensure they have the knowledge and skills to troubleshoot and resolve customer issues efficiently.
- Establish clear escalation and collaboration processes to quickly involve relevant teams or experts when needed.
- Leverage knowledge bases, FAQs, and self-service options to empower customers to find solutions independently, reducing resolution time for simple inquiries.
- Regularly review and refine internal processes to identify bottlenecks and streamline issue resolution.
It is important to balance Resolution Time with other customer service KPIs, such as First Contact Resolution Rate and customer satisfaction metrics. While a quick resolution time is desirable, it should also prioritize delivering effective and satisfactory solutions to customers.
B. Customer Satisfaction Metrics
5. Customer Satisfaction Score (CSAT)
Customer Satisfaction Score (CSAT) is a widely used customer service KPI that measures the level of satisfaction customers have with a specific interaction, product, or service. It provides insights into how well the customer service team meets customer expectations and delivers a positive customer experience.
Explanation:
- CSAT is typically measured through post-interaction surveys or feedback forms where customers rate their satisfaction on a scale (e.g., 1-5, 1-10).
- It captures the customer’s perception of the service received, addressing their needs, and meeting their expectations.
- CSAT surveys can be sent immediately after a customer interaction, or they can be conducted periodically to assess overall customer satisfaction levels.
- The results are aggregated and reported as an average or percentage score, indicating the percentage of satisfied customers.
Why it matters:
- CSAT is a key metric for understanding customer perceptions and gauging their satisfaction with the service provided.
- Higher CSAT scores indicate that customers are more likely to be loyal, make repeat purchases, and refer others to the business.
- Monitoring and improving CSAT helps organizations identify areas for improvement, enhance customer experiences, and build strong customer relationships.
Best practices:
- Implement post-interaction surveys or feedback forms to gather customer satisfaction ratings.
- Keep the survey questions concise and focused on specific aspects of the customer interaction.
- Analyze CSAT data to identify trends, common pain points, and areas where customer expectations are not being met.
- Act on customer feedback by addressing issues, improving processes, and making necessary adjustments to enhance satisfaction.
It is important to remember that CSAT is just one aspect of measuring customer satisfaction. It should be complemented with other metrics like Net Promoter Score (NPS) and Customer Effort Score (CES) to gain a comprehensive understanding of customer perceptions and experiences.
6. Net Promoter Score (NPS)
Net Promoter Score (NPS) is a widely used customer service KPI that measures customer loyalty and the likelihood of customers recommending a company, product, or service to others. It provides insights into overall customer satisfaction and brand advocacy.
Explanation:
- NPS is typically measured through a single question survey: “On a scale of 0-10, how likely are you to recommend our company/product/service to a friend or colleague?”
- Based on their responses, customers are classified into three categories:
- Promoters (score 9-10): Highly satisfied customers who are likely to promote the brand and contribute to its growth.
- Passives (score 7-8): Moderately satisfied customers who may not actively promote the brand but are not likely to detract from it either.
- Detractors (score 0-6): Dissatisfied customers who are more likely to spread negative opinions about the brand.
- NPS is calculated by subtracting the percentage of detractors from the percentage of promoters.
- The resulting score can range from -100 to +100, with higher scores indicating a stronger customer advocacy.
Why it matters:
- NPS provides insights into customer loyalty, satisfaction, and the potential for brand growth through positive word-of-mouth.
- Promoters are valuable assets as they can help attract new customers and positively influence others’ perceptions of the brand.
- Monitoring and improving NPS allows organizations to identify areas for improvement, address customer concerns, and enhance customer loyalty.
Best practices:
- Regularly survey customers and collect NPS data at different touchpoints or stages of the customer journey.
- Follow up with additional questions to gather feedback and understand the reasons behind customers’ ratings.
- Analyze NPS data by segmenting it based on customer demographics, product/service usage, or other relevant factors.
- Actively engage with both promoters and detractors, leveraging promoters for testimonials and advocacy, and addressing detractors’ concerns.
NPS is a valuable metric, but it should be used in conjunction with other customer service KPIs and feedback sources to gain a holistic understanding of customer satisfaction and loyalty. By combining NPS with other metrics, organizations can develop a comprehensive strategy to enhance the customer experience and drive positive brand perception.
7. Customer Effort Score (CES)
Customer Effort Score (CES) is a customer service KPI that measures the ease or difficulty customers experience when interacting with a company’s products, services, or support channels. It assesses the level of effort customers have to exert to get their issues resolved or their needs met.
Explanation:
- CES is typically measured through a survey question: “On a scale of 1-5, how much effort did you have to put forth to handle your request/issue?”
- Customers rate their effort level, with 1 indicating low effort and 5 indicating high effort.
- The score can also be expressed as an average or percentage, providing insights into the overall customer effort level.
- CES focuses on the friction or obstacles customers encounter throughout their journey and how these impact their satisfaction.
Why it matters:
- CES helps organizations understand the impact of customer effort on satisfaction, loyalty, and the overall customer experience.
- High-effort experiences can lead to customer frustration, dissatisfaction, and increased customer churn.
- Monitoring and improving CES allows organizations to identify areas of friction, simplify processes, and enhance the ease of doing business.
Best practices:
- Implement CES surveys at key touchpoints in the customer journey, such as after a support interaction or transaction completion.
- Analyze CES data to identify pain points, complex processes, or areas requiring improvement.
- Take proactive steps to reduce customer effort, streamline processes, and enhance self-service options.
- Seek feedback from customers to understand specific pain points and address them effectively.
CES complements other customer satisfaction metrics, providing a unique perspective on the customer experience. By combining CES with other KPIs, organizations can gain a comprehensive understanding of customer satisfaction, identify opportunities for improvement, and enhance the overall customer journey.
C. Agent Performance Metrics
8. Average Ticket Handle Time
Average Ticket Handle Time is an agent performance metric that measures the average duration it takes for a customer service representative to handle a single customer ticket or case from start to finish. It provides insights into the efficiency and productivity of individual agents in resolving customer issues.
Explanation:
- Average Ticket Handle Time is calculated by summing up the total handling time of all tickets or cases assigned to an agent and dividing it by the number of tickets handled.
- It includes the time spent on activities such as reviewing the ticket, gathering information, investigating the issue, providing assistance, and resolving the customer’s concern.
- This metric focuses on the agent’s ability to efficiently manage and resolve customer inquiries or problems.
- Average Ticket Handle Time can vary depending on the complexity of the tickets and the agent’s expertise.
Why it matters:
- Average Ticket Handle Time is a crucial metric for assessing agent efficiency, productivity, and workload management.
- A lower handle time indicates that agents can handle a higher volume of tickets within a given timeframe.
- Monitoring and improving Average Ticket Handle Time can help organizations optimize resource allocation, identify training needs, and enhance overall team performance.
Best practices:
- Provide comprehensive training to agents to equip them with the necessary skills and knowledge to handle customer tickets efficiently.
- Implement effective ticket management systems and tools to streamline ticket workflows and automate repetitive tasks.
- Encourage agents to follow best practices for ticket handling, such as actively listening to customers, asking clarifying questions, and providing accurate and timely responses.
- Regularly review and provide feedback to agents based on their individual ticket handle time performance.
While Average Ticket Handle Time is an important metric, it should be balanced with other agent performance metrics and customer satisfaction metrics. A focus solely on reducing handle time may impact the quality of customer service. Therefore, organizations should strive to find the right balance between efficiency and delivering excellent customer experiences.
9. Tickets Solved per Agent
Tickets Solved per Agent is an agent performance metric that measures the number of customer tickets or cases resolved by an individual agent within a specific time period. It provides insights into the productivity and effectiveness of agents in handling customer inquiries and issues.
Explanation:
- Tickets Solved per Agent is calculated by counting the total number of tickets resolved by an agent during a defined timeframe.
- It represents the agent’s ability to efficiently and effectively address customer concerns and provide satisfactory resolutions.
- This metric helps assess an agent’s workload management and productivity in resolving customer issues.
- The number of tickets solved can vary based on factors such as ticket complexity, agent expertise, and available resources.
Why it matters:
- Tickets Solved per Agent is a valuable metric for evaluating an agent’s productivity, efficiency, and contribution to the overall team’s performance.
- Higher ticket resolution numbers indicate agents who can handle a larger volume of customer inquiries and provide timely resolutions.
- Monitoring and improving Tickets Solved per Agent can help optimize resource allocation, identify training needs, and enhance overall team performance.
Best practices:
- Provide agents with proper training and resources to efficiently handle a wide range of customer tickets.
- Implement effective ticket management systems that streamline workflows, prioritize tickets, and provide agents with relevant information to resolve issues promptly.
- Encourage agents to follow best practices in ticket resolution, such as utilizing knowledge bases, collaborating with team members, and efficiently documenting solutions.
- Regularly review individual agent performance, provide feedback, and identify opportunities for improvement.
Tickets Solved per Agent is an important metric to gauge an agent’s productivity; however, it should be considered in conjunction with other agent performance metrics and customer satisfaction metrics. A sole focus on ticket volume may overlook the quality of resolutions and customer satisfaction. Striking a balance between ticket volume and quality of service is crucial for delivering exceptional customer experiences.
10. Customer Retention Rate
Customer Retention Rate is a vital customer service KPI that measures the percentage of customers retained by a company over a specific period. It reflects the ability of the organization to maintain customer loyalty and satisfaction, indicating the effectiveness of its customer service efforts.
Explanation:
- Customer Retention Rate is calculated by taking the number of customers at the end of a period, subtracting the number of new customers acquired, and dividing it by the number of customers at the start of the period. The result is then multiplied by 100 to get the percentage.
- This metric provides insights into the company’s ability to retain existing customers and minimize customer churn.
- Customer Retention Rate reflects the success of the organization in delivering value, meeting customer expectations, and building long-term relationships.
Why it matters:
- Customer Retention Rate is a crucial metric as it directly impacts the company’s revenue and profitability.
- Higher retention rates indicate customer satisfaction, loyalty, and a positive customer experience.
- Monitoring and improving Customer Retention Rate helps identify areas for improvement, enhances customer service strategies, and increases customer lifetime value.
Best practices:
- Provide exceptional customer service to ensure customer satisfaction and loyalty.
- Offer personalized experiences and proactive support to address customer needs and concerns.
- Continuously gather and analyze customer feedback to identify pain points and address them promptly.
- Build strong relationships with customers through loyalty programs, exclusive offers, and personalized communications.
Customer Retention Rate is an essential metric to measure the effectiveness of customer service efforts. It should be used in conjunction with other customer satisfaction and loyalty metrics to gain a comprehensive understanding of customer retention and overall business performance. A high Customer Retention Rate indicates that the organization is successfully delivering value and fostering long-term customer relationships.
Related article :Sales KPI: 28 Metrics for Sales Manager – Examples, Meaning, Template, Dashboard

D. Team Efficiency Metrics
11. Service Level Agreement (SLA) Compliance
Service Level Agreement (SLA) Compliance is a team efficiency metric that measures the percentage of customer inquiries or tickets that are resolved within the agreed-upon service level targets. It evaluates the team’s ability to meet response and resolution time commitments as defined in the SLAs.
Explanation:
- SLA Compliance is calculated by dividing the number of tickets resolved within the defined SLA timeframes by the total number of tickets received, and then multiplying it by 100 to obtain the percentage.
- SLAs typically specify response time (e.g., responding to a customer within 24 hours) and resolution time (e.g., resolving an issue within 48 hours).
- This metric assesses the team’s efficiency in meeting customer expectations and honoring the agreed-upon service level commitments.
Why it matters:
- SLA Compliance directly impacts customer satisfaction and the perception of the organization’s responsiveness.
- Meeting SLAs ensures timely support and resolution, leading to enhanced customer experiences.
- Monitoring and improving SLA Compliance helps identify areas for process improvement, resource allocation, and optimizing team performance.
Best practices:
- Clearly define SLAs in terms of response and resolution times, taking into account customer expectations and operational capabilities.
- Monitor ticket handling and resolution times closely to identify potential bottlenecks or areas for improvement.
- Implement effective ticket prioritization systems to ensure high-priority tickets are addressed promptly.
- Regularly review SLA performance, identify areas of non-compliance, and take corrective actions.
SLA Compliance is an important metric to ensure efficient team performance and customer satisfaction. However, it should be balanced with other metrics such as customer satisfaction and resolution quality to provide a comprehensive evaluation of the team’s effectiveness and service delivery. Aiming for high SLA Compliance demonstrates the team’s commitment to meeting customer expectations and delivering quality support within defined timeframes.
12. Backlog of Unresolved Tickets:
Backlog of Unresolved Tickets is a team efficiency metric that measures the number of pending or unresolved customer tickets at a given point in time. It reflects the workload and productivity of the customer service team and provides insights into the team’s ability to manage and address customer inquiries in a timely manner.
Explanation:
- Backlog of Unresolved Tickets is determined by counting the total number of customer tickets or cases that have not been resolved within a specified timeframe.
- It represents the accumulation of pending work and reflects the team’s current workload and capacity.
- This metric highlights the efficiency of the team in managing ticket volume and meeting customer expectations.
Why it matters:
- Backlog of Unresolved Tickets directly impacts customer satisfaction and the overall customer experience.
- A high backlog indicates potential delays in addressing customer issues and can lead to customer dissatisfaction.
- Monitoring and managing the backlog helps maintain service levels, improve response times, and ensure efficient ticket resolution.
Best practices:
- Implement effective ticket management systems that prioritize and assign tickets based on urgency and severity.
- Allocate resources and distribute workload evenly to prevent backlogs from building up.
- Regularly review the backlog status and identify areas for process improvement, resource allocation, and training needs.
- Establish clear escalation and prioritization processes to handle critical or high-priority tickets promptly.
Reducing the backlog of unresolved tickets is crucial for maintaining efficient team performance and delivering timely support to customers. However, it is essential to strike a balance between backlog management and providing quality resolutions. Simply aiming for zero backlog may compromise the thoroughness and quality of ticket resolutions. Therefore, organizations should focus on optimizing workflows, resource allocation, and response times while ensuring a balance between efficiency and customer satisfaction.
13. First Contact Resolution Rate
First Contact Resolution Rate is a team efficiency metric that measures the percentage of customer inquiries or tickets that are resolved successfully during the initial contact with customer support, without the need for further follow-up or escalations. It reflects the team’s ability to address customer issues effectively and efficiently in a single interaction.
Explanation:
- First Contact Resolution Rate is calculated by dividing the number of inquiries or tickets resolved successfully on the first contact by the total number of customer interactions, and then multiplying it by 100 to obtain the percentage.
- Successful resolution means that the customer’s issue or query was fully resolved during the initial interaction without requiring additional contacts or escalations.
- This metric indicates the team’s effectiveness in understanding customer needs, providing accurate information, and delivering satisfactory solutions without unnecessary delays.
Why it matters:
- First Contact Resolution Rate is a key indicator of customer satisfaction and operational efficiency.
- A higher rate indicates that the team is equipped to handle customer issues promptly and effectively, reducing customer effort and enhancing the overall customer experience.
- Monitoring and improving First Contact Resolution Rate can lead to reduced customer frustration, increased customer loyalty, and improved operational efficiency.
Best practices:
- Provide comprehensive training to customer service representatives to enhance their product knowledge, problem-solving skills, and communication abilities.
- Encourage active listening and thorough understanding of customer issues to ensure accurate and effective resolutions.
- Implement knowledge bases, tools, and resources to empower agents with the information they need to address customer inquiries efficiently.
- Regularly evaluate customer interactions, provide feedback to agents, and identify areas for improvement.
Achieving a high First Contact Resolution Rate requires a customer-centric approach, well-trained agents, and streamlined processes. However, it’s important to balance efficiency with quality, ensuring that resolutions are accurate and satisfactory for customers. Striving for a high First Contact Resolution Rate helps organizations deliver excellent customer service and build strong customer relationships based on prompt and effective issue resolution.
14. Escalation Rate
Escalation Rate is a team efficiency metric that measures the percentage of customer inquiries or tickets that require escalation to a higher level of support or management for resolution. It reflects the team’s ability to handle and resolve complex or challenging customer issues within their own level of support.
Explanation:
- Escalation Rate is calculated by dividing the number of escalated tickets by the total number of customer inquiries or tickets received, and then multiplying it by 100 to obtain the percentage.
- An escalated ticket refers to a customer issue that could not be resolved by the initial support agent and requires intervention from a higher-level support team member or manager.
- This metric indicates the team’s capability to handle a broad range of customer issues independently and efficiently.
Why it matters:
- Escalation Rate highlights the complexity and difficulty level of customer issues that the initial support team can handle effectively.
- A high escalation rate may indicate gaps in agent training, knowledge, or authority levels, which can impact customer satisfaction and resolution times.
- Monitoring and managing the escalation rate can help identify training needs, optimize support processes, and improve overall team performance.
Best practices:
- Provide comprehensive training to support agents to enhance their technical skills, product knowledge, and problem-solving abilities.
- Empower agents with decision-making authority and clear guidelines on when and how to escalate issues.
- Foster a culture of knowledge sharing and collaboration within the team to enable agents to access collective expertise and resolve issues independently.
- Regularly review escalated tickets to identify common patterns, areas for improvement, and opportunities for skill development.
A lower Escalation Rate indicates that the team can handle a greater percentage of customer issues independently, resulting in faster resolution times, increased customer satisfaction, and reduced dependency on higher-level support resources. Striving to minimize the escalation rate through continuous training and knowledge development allows the team to deliver efficient and effective support while building customer trust and loyalty.

E. Quality Metrics
15. Call Quality Score
Call Quality Score is a quality metric that measures the performance and effectiveness of customer service representatives during phone interactions with customers. It assesses the overall quality of the customer service provided, including communication skills, problem-solving abilities, professionalism, and adherence to company standards.
Explanation:
- Call Quality Score is typically evaluated through a standardized scoring system or rubric that assesses various aspects of the phone interaction, such as agent demeanor, accuracy of information, active listening, empathy, and resolution effectiveness.
- This metric involves monitoring and evaluating recorded calls or conducting live call assessments to measure the quality of interactions between agents and customers.
- Call Quality Score helps identify areas of strength and improvement for individual agents and the team as a whole.
Why it matters:
- Call Quality Score directly impacts customer satisfaction, perception of the company, and the overall customer experience.
- Higher scores indicate that agents consistently deliver high-quality service, resulting in customer loyalty and positive word-of-mouth.
- Monitoring and improving Call Quality Score contributes to enhanced customer interactions, improved resolution rates, and increased customer satisfaction.
Best practices:
- Develop a standardized call evaluation rubric that aligns with company values, customer expectations, and service standards.
- Provide training and coaching to agents to improve their communication skills, active listening, and problem-solving abilities.
- Conduct regular call assessments and provide feedback to agents to identify strengths and areas for improvement.
- Foster a culture of continuous improvement by promoting knowledge sharing, best practices, and ongoing training opportunities.
Monitoring and improving Call Quality Score is essential for delivering exceptional customer service over the phone. By consistently assessing and enhancing the quality of interactions, organizations can ensure that their customers receive professional and effective support, leading to higher customer satisfaction, increased loyalty, and positive brand perception.
16. Email Quality Score
Email Quality Score is a quality metric that measures the performance and effectiveness of customer service representatives in handling customer inquiries and issues through email communication. It assesses the overall quality of email responses, including clarity, accuracy, professionalism, responsiveness, and adherence to company guidelines and standards.
Explanation:
- Email Quality Score is typically evaluated through a standardized scoring system or rubric that assesses various aspects of the email response, such as grammar and spelling, tone of voice, completeness of information, resolution effectiveness, and adherence to company branding and style.
- This metric involves reviewing and evaluating sample email interactions between agents and customers to assess the quality of written communication.
- Email Quality Score helps identify areas of improvement, training needs, and best practices to enhance the quality and effectiveness of email support.
Why it matters:
- Email Quality Score directly impacts customer satisfaction and the perception of the company’s professionalism and attention to detail.
- Higher scores indicate that agents consistently provide clear, concise, and helpful email responses, leading to improved customer experiences and increased trust.
- Monitoring and improving Email Quality Score contribute to enhanced customer interactions, improved response times, and increased customer satisfaction.
Best practices:
- Develop a standardized email evaluation rubric that aligns with company values, customer expectations, and service standards.
- Provide training and guidelines to agents on effective email communication, including grammar and spelling, tone, formatting, and response time.
- Regularly review and assess sample email interactions to identify areas for improvement and provide constructive feedback to agents.
- Foster a culture of continuous improvement by encouraging agents to share best practices, provide peer feedback, and participate in ongoing training programs.
Monitoring and improving Email Quality Score is crucial for delivering excellent customer service through written communication. By ensuring that email responses are clear, accurate, and professional, organizations can provide timely and effective support, leading to higher customer satisfaction, improved resolution rates, and strengthened customer relationships.
17. Live Chat Quality Score
Live Chat Quality Score is a quality metric that measures the performance and effectiveness of customer service representatives during live chat interactions with customers. It assesses the overall quality of the chat support provided, including responsiveness, communication skills, problem-solving abilities, and adherence to company standards.
Explanation:
- Live Chat Quality Score is typically evaluated through a standardized scoring system or rubric that assesses various aspects of the chat interaction, such as agent responsiveness, accuracy of information provided, clarity of responses, empathy, and resolution effectiveness.
- This metric involves monitoring and evaluating live chat conversations between agents and customers to assess the quality of interactions in real-time.
- Live Chat Quality Score helps identify areas of improvement for individual agents and the team, as well as best practices to enhance the quality and effectiveness of live chat support.
Why it matters:
- Live Chat Quality Score directly impacts customer satisfaction and the overall customer experience with the chat support provided.
- Higher scores indicate that agents consistently deliver high-quality live chat support, resulting in positive customer experiences and increased trust.
- Monitoring and improving Live Chat Quality Score contribute to improved response times, enhanced customer interactions, and increased customer satisfaction.
Best practices:
- Develop a standardized live chat evaluation rubric that aligns with company values, customer expectations, and service standards.
- Provide training and coaching to agents to improve their live chat communication skills, active listening, and problem-solving abilities.
- Conduct regular assessments of live chat interactions and provide timely feedback to agents to identify strengths and areas for improvement.
- Foster a culture of continuous improvement by promoting knowledge sharing, sharing chat best practices, and offering ongoing training opportunities.
Monitoring and improving Live Chat Quality Score is essential for delivering exceptional customer service through live chat support. By consistently assessing and enhancing the quality of live chat interactions, organizations can ensure that their customers receive efficient and effective support, leading to higher customer satisfaction, increased loyalty, and positive brand perception.
F. Channel-Specific Metrics
18. Average Wait Time (phone)
Average Wait Time (phone) is a channel-specific metric that measures the average amount of time a customer waits in the queue before speaking with a customer service representative during a phone call. It reflects the efficiency of call handling and provides insights into the customer’s experience in terms of wait times.
Explanation:
- Average Wait Time (phone) is calculated by summing up the total wait times for all calls and dividing it by the total number of calls answered by agents.
- This metric includes the time spent by customers in the queue waiting for their call to be answered by an available representative.
- It provides an understanding of the typical wait time customers experience before being connected to an agent.
Why it matters:
- Average Wait Time directly impacts customer satisfaction and the perception of prompt service.
- Longer wait times can lead to customer frustration, dissatisfaction, and even abandonment of the call.
- Monitoring and managing Average Wait Time helps organizations optimize call center staffing, improve resource allocation, and enhance overall customer experience.
Best practices:
- Regularly analyze call volume patterns to identify peak hours or busy periods and allocate staffing resources accordingly.
- Implement call routing systems that distribute calls evenly across available agents and minimize wait times.
- Provide customers with options for callback instead of waiting on hold, if feasible.
- Continuously evaluate and refine call handling processes to minimize wait times without compromising service quality.
Reducing Average Wait Time contributes to improved customer satisfaction and a positive calling experience. By minimizing wait times, organizations can provide more efficient and timely support, leading to higher customer satisfaction, reduced customer churn, and increased customer loyalty.
19. Average Time to Resolve (email)
Average Time to Resolve (email) is a channel-specific metric that measures the average amount of time taken to resolve customer inquiries or issues through email communication. It provides insights into the efficiency and effectiveness of the email support process in addressing customer concerns.
Explanation:
- Average Time to Resolve (email) is calculated by summing up the total time taken to resolve all emails and dividing it by the total number of emails resolved.
- This metric includes the time spent by agents in reading, understanding, researching, and crafting a response to customer emails.
- It reflects the average duration from the initial receipt of an email to the final resolution or response.
Why it matters:
- Average Time to Resolve (email) impacts customer satisfaction and the perceived speed and efficiency of email support.
- Prolonged resolution times can lead to customer frustration and dissatisfaction.
- Monitoring and managing Average Time to Resolve (email) helps optimize email support processes, identify bottlenecks, and improve overall responsiveness.
Best practices:
- Implement email management systems that prioritize and route emails to appropriate agents efficiently.
- Provide agents with access to knowledge bases, templates, and resources to facilitate quick and accurate responses.
- Encourage agents to communicate proactively with customers, providing timely updates on the progress of their inquiries.
- Continuously evaluate and streamline internal processes to reduce resolution times without compromising the quality of responses.
Reducing Average Time to Resolve (email) is crucial for delivering timely and effective support to customers. By optimizing email response times, organizations can enhance customer satisfaction, increase customer loyalty, and improve overall email support efficiency.
20. Average Response Time (live chat)
Average Response Time (live chat) is a channel-specific metric that measures the average amount of time it takes for a customer service representative to respond to a customer’s message or inquiry during a live chat interaction. It reflects the speed and efficiency of live chat support in providing timely responses to customer inquiries.
Explanation:
- Average Response Time (live chat) is calculated by summing up the total response times for all live chat interactions and dividing it by the total number of responses provided by agents.
- This metric includes the time it takes for agents to read the customer’s message, formulate a response, and send it back to the customer.
- It reflects the average duration from the customer sending a message to receiving a response from the agent.
Why it matters:
- Average Response Time (live chat) directly impacts customer satisfaction and the perceived responsiveness of live chat support.
- Long response times can lead to customer frustration, impatience, and potential abandonment of the chat.
- Monitoring and managing Average Response Time (live chat) helps organizations optimize live chat staffing, improve agent productivity, and enhance the overall customer experience.
Best practices:
- Implement chat management systems that provide real-time alerts for incoming chat messages and distribute chats evenly among available agents.
- Train agents to respond promptly while maintaining accuracy and quality in their responses.
- Utilize canned responses or templates for common inquiries to expedite response times.
- Continuously monitor response times and identify areas for improvement to enhance overall chat support efficiency.
Reducing Average Response Time (live chat) is essential for providing timely and efficient support to customers. By ensuring quick responses during live chat interactions, organizations can enhance customer satisfaction, improve customer retention, and deliver a positive chat support experience.

Examples and Templates for Customer Service KPI
Illustrative examples of how to calculate and use each KPI
A. Response Time Metrics:
- Average Response Time:
- Calculation: Sum up the total response times for all customer interactions and divide it by the total number of responses.
- Use: Measure the overall speed of response to customer inquiries, set benchmarks for response time targets, and identify areas for improvement in agent efficiency and responsiveness.
- First Response Time:
- Calculation: Measure the time taken from the receipt of a customer inquiry to the first response provided by an agent.
- Use: Assess the speed of initial customer engagement, optimize agent workload distribution, and ensure timely acknowledgment of customer inquiries.
- Average Handle Time:
- Calculation: Sum up the total handle times for all resolved customer interactions and divide it by the total number of resolved interactions.
- Use: Evaluate agent productivity, identify opportunities for process optimization, and improve overall efficiency in handling customer inquiries.
B. Customer Satisfaction Metrics:
- Customer Satisfaction Score (CSAT):
- Calculation: Conduct post-interaction surveys and ask customers to rate their satisfaction on a scale (e.g., 1-5).
- Use: Measure customer satisfaction levels, identify areas for improvement in service delivery, and track customer sentiment over time.
- Net Promoter Score (NPS):
- Calculation: Ask customers a question about their likelihood to recommend the company on a scale (e.g., 0-10) and calculate the percentage of Promoters minus the percentage of Detractors.
- Use: Assess customer loyalty, identify brand advocates, and gauge overall customer sentiment and willingness to recommend the company.
- Customer Effort Score (CES):
- Calculation: Ask customers to rate the level of effort required to resolve their issue on a scale (e.g., 1-5).
- Use: Evaluate the ease of the customer experience, identify pain points in the customer journey, and prioritize efforts to reduce customer effort.
C. Agent Performance Metrics:
- Average Ticket Handle Time:
- Calculation: Calculate the average time taken by an agent to handle and resolve a ticket.
- Use: Measure agent efficiency, identify training needs, and optimize workflows to reduce resolution times.
- Tickets Solved per Agent:
- Calculation: Divide the total number of tickets resolved by the total number of agents.
- Use: Evaluate agent productivity, distribute workload equitably, and identify high-performing agents for recognition and rewards.
D. Team Efficiency Metrics:
- Customer Retention Rate:
- Calculation: Divide the number of customers retained over a specific period by the total number of customers at the beginning of that period.
- Use: Measure customer loyalty and satisfaction, identify factors influencing customer churn, and develop strategies for customer retention.
- Service Level Agreement (SLA) Compliance:
- Calculation: Measure the percentage of customer interactions that are resolved within the defined SLA timeframe.
- Use: Assess the team’s ability to meet service level commitments, identify areas for improvement in response times, and ensure customer expectations are met.
- Backlog of Unresolved Tickets:
- Calculation: Count the number of tickets that remain unresolved beyond a specific timeframe.
- Use: Monitor and manage ticket backlog, allocate resources effectively, and prioritize tickets based on urgency and impact.
- First Contact Resolution Rate:
- Calculation: Divide the number of customer inquiries resolved on the first contact by the total number of customer interactions.
- Use: Measure the effectiveness of agent problem-solving skills, improve customer experience by reducing the need for follow-up interactions, and streamline internal processes.
E. Quality Metrics:
- Call Quality Score:
- Calculation: Assess recorded or live calls based on predetermined criteria (e.g., agent professionalism, accuracy, empathy) and assign scores.
- Use: Evaluate agent performance, identify coaching and training needs, and maintain consistent service quality standards.
- Email Quality Score:
- Calculation: Evaluate email responses based on predetermined criteria (e.g., accuracy, clarity, tone) and assign scores.
- Use: Assess the quality of written communication, provide feedback to agents, and ensure consistent and effective email support.
- Live Chat Quality Score:
- Calculation: Evaluate live chat interactions based on predetermined criteria (e.g., response time, accuracy, resolution) and assign scores.
- Use: Measure the quality of chat support, identify areas for improvement in agent performance, and enhance the customer experience during live chat interactions.
By utilizing these examples and templates for customer service KPIs, organizations can effectively measure team performance, identify areas for improvement, and enhance customer satisfaction. It is important to adapt these KPIs and calculations to specific business needs and objectives, and regularly review and analyze the data to drive continuous improvement in customer service delivery.
Recommended templates for tracking and reporting KPIs effectively
- KPI Dashboard:
- Create a centralized KPI dashboard that displays key customer service metrics in a visually appealing and easy-to-understand format.
- Include graphs, charts, or tables to showcase KPI trends, targets, and performance over time.
- Update the dashboard regularly to provide real-time insights and enable quick assessment of performance.
- Scorecards:
- Develop individual or team scorecards that list the KPIs to be tracked and their corresponding targets.
- Assign weights or importance levels to each KPI to prioritize and emphasize specific metrics.
- Provide a visual representation of progress towards targets, such as color-coding or progress bars, to facilitate quick analysis.
- Data Visualization Tools:
- Utilize data visualization tools, such as Excel charts, Google Data Studio, or Tableau, to create interactive visual representations of KPI data.
- Generate charts, graphs, or heatmaps to present KPI trends, comparisons, and correlations effectively.
- Customize the visualizations to highlight the most relevant information and enable easy data exploration.
- Performance Reports:
- Generate comprehensive performance reports on a regular basis, such as weekly, monthly, or quarterly.
- Include an overview of each KPI, its definition, calculation method, and current performance.
- Analyze trends, highlight achievements or areas of improvement, and provide actionable insights based on the KPI data.
- Automated Tracking Systems:
- Implement automated tracking systems, such as customer service software or CRM platforms, to collect and analyze KPI data.
- Leverage the built-in reporting capabilities of these systems to generate customized reports and automate data gathering.
- Set up alerts or notifications to receive real-time updates or triggers when KPI thresholds or targets are met.
- Performance Improvement Plans:
- Develop performance improvement plans for individual agents or teams based on KPI data.
- Clearly define goals, action steps, and timelines to address areas of improvement identified through KPI analysis.
- Regularly monitor progress and provide ongoing feedback and coaching to support performance enhancement.
Remember, the effectiveness of the templates and reporting methods will depend on the specific needs and preferences of your organization. Customize the templates to align with your KPIs, reporting cadence, and desired level of detail. Regularly review and refine the templates to ensure they capture the most relevant and actionable information for tracking and reporting customer service KPI effectively.
Creating a Customer Service KPI Dashboard
Key elements to include in a customer service KPI dashboard
- KPI Summary: Provide an overview of the most important customer service KPI, such as response time, customer satisfaction score (CSAT), and first contact resolution rate.
- Visual Representations: Utilize charts, graphs, or gauges to present KPI trends and performance levels. Choose appropriate visualizations based on the nature of the data and the insights you want to convey.
- Targets and Thresholds: Set clear targets or thresholds for each KPI, indicating the desired performance level or the point at which attention or intervention is required.
- Historical Performance: Display historical performance data to highlight trends, patterns, and progress over time. This helps identify seasonal variations and assess the impact of specific initiatives or changes.
- Comparative Analysis: Include benchmarks or comparative data to provide context and allow for comparisons against industry standards or internal goals.
- Drill-Down Functionality: Enable users to drill down into specific KPIs or segments of data for a more detailed analysis. This allows for deeper insights and the identification of root causes.
- Data Sources and Updates: Clearly indicate the sources of data used in the dashboard and the frequency of updates. Ensure that the data is accurate, reliable, and up-to-date.
Best Practices for Sharing and Leveraging Dashboard Insights
- Share the dashboard with relevant stakeholders, such as customer service managers, team leads, and executives, who can use the insights to make informed decisions.
- Regularly review the dashboard with the team to foster a data-driven culture, encourage accountability, and drive performance improvement.
- Use the dashboard as a tool for ongoing performance discussions, identifying areas for coaching, training, and process enhancements.
- Encourage collaboration and transparency by allowing team members to contribute to the dashboard, providing their input and insights.
- Consider automating the dashboard updates and sharing processes to ensure timely availability of data and minimize manual effort.
- Continuously assess and refine the dashboard based on feedback and evolving business needs, adding or removing KPIs as necessary.

Importance of a Centralized Dashboard for Visualizing KPIs using DoerHRM Software
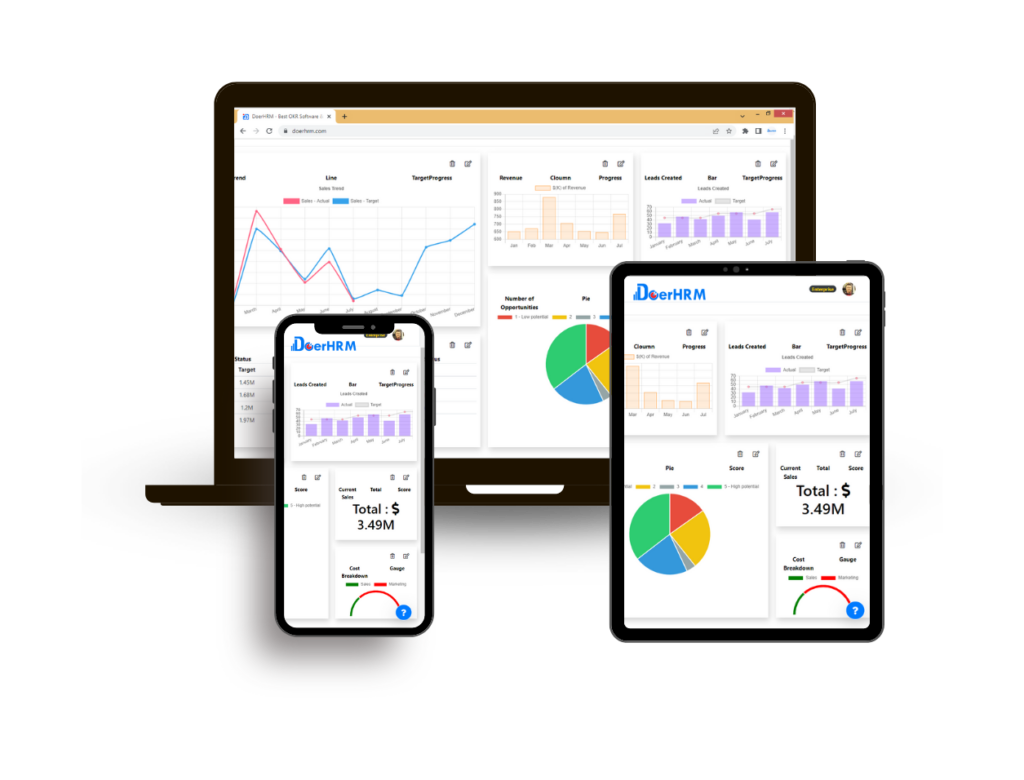
A centralized dashboard is a critical tool for visualizing and tracking key customer service KPI, and DoerHRM software provides a powerful platform to achieve this. Here’s an explanation of the importance of a centralized dashboard and how DoerHRM software can enhance the visualization of KPIs:
Holistic View of Performance: A centralized dashboard in DoerHRM allows customer service teams to access a comprehensive view of their performance in a single platform. It brings together various KPIs, such as response time, customer satisfaction score (CSAT), and first contact resolution rate, providing a holistic snapshot of team performance.
Real-time Data: DoerHRM software ensures that the KPI dashboard is constantly updated with real-time data. This enables teams to have access to the most recent performance information, allowing for timely decision-making and the ability to address issues promptly.
Customization and Flexibility: DoerHRM software offers customization options, allowing teams to tailor the KPI dashboard to their specific needs. Users can select and arrange the KPIs that are most relevant to their customer service goals and objectives. This flexibility ensures that the dashboard reflects the unique requirements of the organization.
Visual Representation: The DoerHRM software’s dashboard provides visual representations of KPIs using various charts, graphs, and gauges. This visual format enhances data comprehension and allows for quick identification of performance trends, patterns, and anomalies. The use of visually appealing and interactive charts makes it easier for stakeholders to interpret and analyze the data effectively.
Drill-down Functionality: DoerHRM software incorporates drill-down functionality, allowing users to delve deeper into specific KPIs or segments of data. This feature enables a more detailed analysis of performance, empowering teams to identify underlying factors influencing their KPI results. By exploring the data at a granular level, teams can uncover insights and take targeted actions to improve their customer service performance.
Collaboration and Transparency: DoerHRM software promotes collaboration and transparency among team members by providing shared access to the KPI dashboard. This facilitates cross-functional communication, as stakeholders from different departments can access and contribute to the dashboard. It encourages data-driven discussions, fostering a culture of accountability and collective efforts towards achieving customer service goals.
Reporting and Exporting Capabilities: DoerHRM software enables users to generate customizable reports from the KPI dashboard. These reports can be easily exported and shared with stakeholders, such as customer service managers and executives. The reporting capabilities of DoerHRM software facilitate the dissemination of insights, progress updates, and performance trends to relevant decision-makers.
By leveraging DoerHRM software’s capabilities for creating a centralized dashboard, customer service teams can streamline their KPI tracking and reporting processes. The software’s features, including real-time data updates, visual representations, drill-down functionality, and collaboration capabilities, enhance the effectiveness of the KPI dashboard. With DoerHRM software, organizations can achieve greater visibility into their customer service performance, make data-driven decisions, and drive continuous improvement in delivering exceptional customer experiences.
Conclusion
Customer service KPI play a vital role in assessing team performance and enhancing customer satisfaction. Throughout this article, we have explored various customer service KPI and their significance in measuring team performance. It is essential to implement and regularly monitor these KPIs to drive continuous improvement and deliver exceptional customer experiences.
By tracking KPIs such as response time, customer satisfaction scores (CSAT), first contact resolution rate, and average handle time, organizations can gain valuable insights into their customer service operations. These metrics help identify areas for improvement, optimize resource allocation, and enhance overall team efficiency. Moreover, customer-centric metrics like Net Promoter Score (NPS), Customer Effort Score (CES), and customer retention rate provide insights into customer loyalty, satisfaction, and the ease of doing business with the organization.
Additionally, agent performance metrics such as average ticket handle time and tickets solved per agent contribute to assessing individual performance and identifying training and coaching needs. Team efficiency metrics, including service level agreement (SLA) compliance and backlog of unresolved tickets, enable organizations to monitor and manage service levels effectively.
Quality metrics like call quality score, email quality score, and live chat quality score help ensure consistent service delivery and maintain high standards of customer interactions across various channels.
To effectively utilize these KPIs, it is recommended to create a centralized customer service KPI dashboard, leveraging software like DoerHRM. This dashboard provides a holistic view of team performance, offers real-time data updates, enables customization and drill-down functionality, and promotes collaboration and transparency among team members.
In conclusion, organizations should recognize the importance of customer service KPI and proactively implement strategies to monitor and improve relevant metrics. By regularly assessing team performance using these KPIs, businesses can identify areas for enhancement, allocate resources effectively, and ultimately provide exceptional customer service experiences. Embracing a data-driven approach and utilizing tools like DoerHRM software can contribute to the success of customer service teams and foster long-term customer satisfaction and loyalty.