
Group-Wide KPI Command
Every Subsidiary's KPI Down to One Employee.
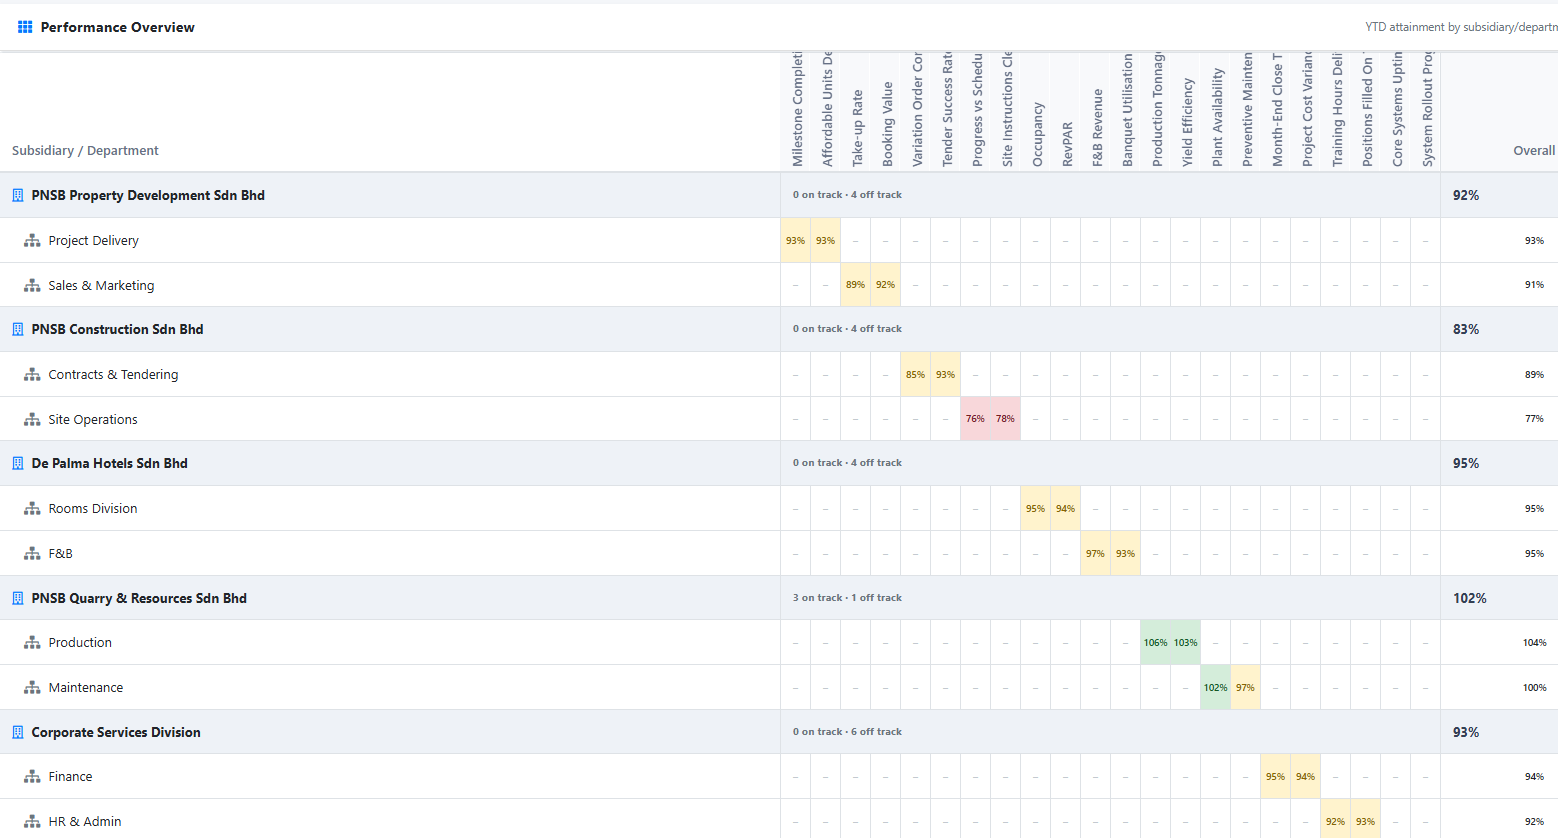
Performance Deep Dive gives multi-division groups one standardised measurement fabric: a colour-coded heatmap of every subsidiary and department against every KPI, with drill-down to the individual behind any number.
Trusted by 100+ Organizations for KPI, HR, and Performance Management
DoerHRM supports organizations with KPI software, HR solutions, performance management, KPI training, coaching, and practical business improvement programs.










Drill-Down in a Few Clicks
Every number traces back
to the person behind it.
A department total is never the end of the story — expand it and the same live figures roll all the way down to a single employee's own KPI, no separate spreadsheet or status-update meeting required.
Group
Where the roll-up begins — overall group attainment.
Subsidiary
Which business unit is pulling its weight.
Department
The department accountable for the number.
Individual
The named individual — so responsibility follows the reporting line.
The Problem This Solves
KPI reporting, before and after
one shared measurement fabric.
KPI management usually dies in spreadsheets, with every subsidiary reporting differently and a month late.
| Reporting Capability & Impact |
Without DoerHRM (Traditional Way) |
With DoerHRM (Live KPI Fabric) |
|---|---|---|
Data Freshness & Speed How quickly group performance is visible |
30-Day Lag & Monthly Batches
Data is compiled once a month via email attachments; reports are already outdated when reviewed. |
Real-Time Live Updates
Actuals update instantly as subsidiaries enter data — zero waiting for month-end compilation. |
Drill-Down & Accountability Tracing numbers back to responsible teams |
Dead-End Static Reports
Underperformance hides inside group averages; requires manual status meetings to find who owns a number. |
3-Click Drill to Named Individual
Click any department cell on the heatmap to expand down to the exact employee accountable for it. |
Standardisation Across Group Consistency of metrics across subsidiaries |
Fragmented & Inconsistent Formats
Every subsidiary (Property, Construction, Hotels, Quarry) uses custom Excel sheets, PDFs, or chat text. |
One Shared Measurement Fabric
All business units report on standard KPI matrices with automated rollups into group-wide dashboards. |
Audit Trail & Data Integrity Verifying calculation accuracy & history |
High Error Risk & No History
Broken Excel formulas and manual copy-paste create unverified figures with no change history. |
Automated Integrity & Versioning
System-enforced formula validation and complete audit trail tracing every single target vs actual. |
Executive Decision Speed Translating data into management action |
Reactive Crisis Management
Leaders discover underperformance weeks after it happens, when corrective action is costly and late. |
Proactive Intervention
Color-coded heatmaps highlight risks instantly so management attention lands exactly where it's needed most. |
Full KPI Traceability
Every cell on the heatmap has a name behind it.
The same numbers rolled up through the organisation hierarchy, from group level down through subsidiary, department and named individual — so responsibility follows the reporting line.
1
Group — The Roll-Up
Overall group attainment sits at the top, built from every subsidiary underneath it.
2
Subsidiary — The Business Unit
Property development, construction, hospitality, quarrying, corporate services — each subsidiary carries its own departments and KPI columns.
3
Department — The Owner
The team accountable for the KPI in question, with its own colour-coded status on the heatmap.
4
KPI — The Number
Every KPI listed with monthly actual-vs-target figures, the responsible employee, and a YTD-vs-target progress bar.
5
Named Individual — The Owner
Any department total can be expanded down to the individual contributing to it — a number that can’t hide behind a status meeting.
Three Lenses on One Data Model
Click a tab. Same live
data, every time.
No re-entry, no separate spreadsheets per view — the same underlying KPI data, viewed the way each audience needs it. The Charts view provides visual analytics further down the page.
| Department | KPI | Employee | Jan | Feb | Mar | Apr | May | Jun | YTD vs Target |
|---|---|---|---|---|---|---|---|---|---|
| Crestview Property Development Sdn Bhd · 92% overall · 0 on track · 4 off track View subsidiary » | |||||||||
| Project Delivery · 93% overall View department » | |||||||||
Milestone Completion ratio % Antara Gapi Township P... +1 | ▸ Dept Total | 87% /100% 87% | 89.8% /100% 90% | 91.8% /100% 92% | 93.8% /100% 94% | 96% /100% 96% | 98.8% /100% 99% | 92.8% / 100%93% | |
Affordable Units Delivered count Rumah Selangorku Affo... | ▸ Dept Total | 293 /360 81% | 308 /360 86% | 325 /360 90% | 342 /360 95% | 357 /360 99% | 374 /360 104% | 1,999 / 2,16093% | |
| Sales & Marketing · 91% overall View department » | |||||||||
Take-up Rate ratio % Antara Gapi Township P... | ▸ Dept Total | 67% /80% 84% | 69% /80% 86% | 70% /80% 88% | 72% /80% 90% | 74% /80% 93% | 76% /80% 95% | 71.3% / 80%89% | |
Booking Value RM | ▸ Dept Total | RM147,920 /183,333 81% | RM156,176 /183,333 85% | RM164,432 /183,333 90% | RM172,688 /183,333 94% | RM180,944 /183,333 99% | RM189,200 /183,333 103% | RM1.0m / RM1.1m92% | |
Illustrative demo data — figures do not represent any real company's results.
| KPI / Owner | Jan | Feb | Mar | Apr | May | Jun | YTD vs Target |
|---|---|---|---|---|---|---|---|
| ▾ Project Delivery · 93% overall View department » | |||||||
Milestone Completion | 87% /100% 87% | 89.8% /100% 90% | 91.8% /100% 92% | 93.8% /100% 94% | 96% /100% 96% | 98.8% /100% 99% | 92.8% / 100% |
Affordable Units Delivered | 293 /360 81% | 308 /360 86% | 325 /360 90% | 342 /360 95% | 357 /360 99% | 374 /360 104% | 1,999 / 2,160 |
| ▾ Aisyah binti Rahman 96% avg View individual » | |||||||
Milestone Completion ratio % Antara Gapi Township P... +1 | 88% /100% 88% | 91% /100% 91% | 93% /100% 93% | 95% /100% 95% | 97% /100% 97% | 100% /100% 100% | 94% / 100% |
Affordable Units Delivered count Rumah Selangorku Affo... | 155 /180 86% | 163 /180 91% | 172 /180 96% | 181 /180 101% | 189 /180 105% | 198 /180 110% | 1,058 / 1,080 |
| ▸ Sales & Marketing · 91% overall View department » | |||||||
Illustrative demo data — figures do not represent any real company's results.
Visual Analytics: Charts
When a number looks healthy,
the chart proves otherwise.
Four live charts — no setup, no export. See which subsidiary is lagging, which KPIs are on a downward trend, and which projects are burning budget faster than they’re progressing. All computed from the same data driving the table views.
Compare every business unit’s overall KPI attainment side by side. One green bar means someone’s hitting target — every amber bar is a gap still open.
Group-wide proportion of KPIs by health status. The larger the amber and red segments, the more management attention the portfolio needs right now.
Month-over-month movement for key KPIs. A rising line means the metric is improving — a falling line means it’s decaying before it shows up as red on the heatmap.
When the grey bar (budget used) overtakes the blue (physical progress), the project is spending faster than it’s delivering — an early warning, not an end-of-quarter surprise.
Everything You Need
Two views, no re-entry, one source of truth.
Group-Wide Heatmap
Every subsidiary and department against every KPI, colour-coded, on one screen.
Drill-Down in a Few Clicks
From group level down to a single employee’s KPI, without leaving the screen.
Interchangeable Views
By KPI, By Org Chart, By Project, and Charts — same live data, no re-entry.
Lowest-Performing KPIs Ranking
A named list of the worst-attaining metrics and exactly which department owns them.
Monthly Trend Lines
See whether a metric is improving or decaying month over month, not just its current snapshot.
On-Track / At-Risk / Behind Mix
A single status donut summarising the health of every KPI in the group.
Frequently Asked Questions
Frequently Asked Questions about Strategy Map & Roadmap
KPI Performance Management software is a tool that helps businesses measure and track their performance against specific goals and key performance indicators (KPIs). It allows businesses to monitor progress, identify areas for improvement, and make data-driven decisions.
KPI Performance Management software can help your business improve its performance by setting clear goals and KPIs, tracking progress in time, identifying areas for improvement, and optimizing performance based on data insights.
KPI Performance Management software can track and measure a wide range of KPIs, including financial metrics, customer satisfaction, department performance, employee performance, project management, and more. The software should allow users to define their own KPIs based on their specific business needs.
The software should be able to track and report KPI performance using in time data dashboards, custom reports, and alerts. It should also allow users to drill down into specific data points to gain deeper insights into their performance.
Yes, KPI Performance Management software should be customizable to fit the specific needs of your business. It should allow users to define their own KPIs, set goals, and track performance based on their unique requirements.
Yes, KPI Performance Management software should be designed to be user-friendly and easy to implement. It should have a modern interface that is intuitive to use and offer support and training resources to help users get started.
KPI Performance Management software should include a range of data visualization and reporting features, including In-time dashboards, custom reports, charts, and graphs. These features should allow users to gain insights into their performance at a glance.
KPI Performance Management software should have strong security measures in place to protect sensitive business data. This can include data encryption, access controls, regular backups, and compliance with data privacy regulations such as ISO 27001, PCI DSS 3.2.1 and SOC TSP.
Stop chasing spreadsheets.
Start seeing the whole group.
Get a live walkthrough of Performance Deep Dive on your own subsidiaries, departments and KPIs.