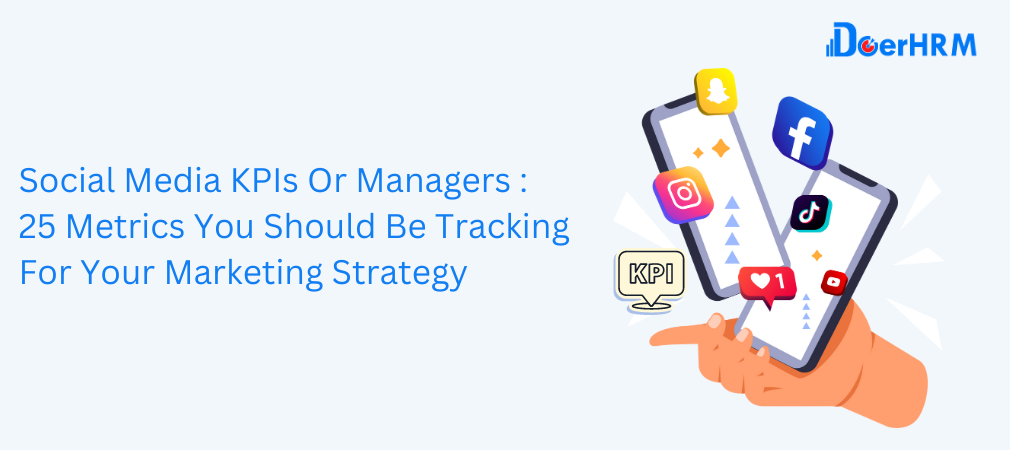
Social media KPIs has become an essential marketing tool for businesses of all sizes. However, it’s not enough to simply post content and hope for the best. To ensure that your social media campaigns are successful, it’s crucial to track key performance indicators (KPIs) that help measure the effectiveness of your efforts.
KPIs are specific metrics that are used to evaluate the success of a particular activity or campaign. In the context of social media marketing, KPIs are used to track and measure the performance of your social media campaigns, including engagement rates, reach, conversions, brand awareness, and customer satisfaction.
By tracking these metrics, managers can gain valuable insights into their social media campaigns, allowing them to make data-driven decisions and optimize their strategies for maximum impact. Social media KPIs help managers understand which posts are resonating with their audience, which social media platforms are driving the most engagement, and which campaigns are generating the highest ROI.
In short, social media KPIs are critical to the success of any social media marketing strategy. Without tracking these metrics, it’s impossible to know whether your campaigns are effective and whether your social media presence is making a positive impact on your business.
In this article, we will explore about the importance of tracking social media KPIs for managers in their marketing strategy. We will define KPIs and their significance in measuring the success of social media campaigns. Additionally, we will cover key social media KPIs for managers, social media platforms, and tools for tracking social media KPIs.
Related article : What is a Key Performance Indicator (KPI)? Meaning, Templates, Examples
Table of Contents
Key Social Media KPIs for Managers
Engagement Metrics
1. Likes, Shares, Comments
Likes, Shares, and Comments are some of the most fundamental engagement metrics for social media campaigns. These metrics measure how users are interacting with a specific post and help managers determine the level of engagement and interest generated by the content.
Likes: Likes are an essential metric that measures the number of users who have clicked the ‘like’ button on a post. Likes are an indication that the content has resonated with the audience, and they are a simple way for users to show their support and approval for a post.
Shares: Shares measure the number of times a post has been shared by users on social media. When a user shares a post, it is typically because they found the content informative, interesting, or entertaining and want to share it with their own network of followers. Shares can help a post reach a larger audience and generate more engagement.
Comments: Comments are a metric that measures the number of user-generated comments on a post. Comments can be a powerful tool for engagement, as they encourage users to participate in a conversation and provide feedback on the content. Managers can use comments to gain insights into their audience’s thoughts, opinions, and preferences, and use this information to optimize their content strategy.
Overall, likes, shares, and comments are essential metrics for managers to track, as they provide a clear indication of how well their content is resonating with their audience. By monitoring these metrics, managers can gain valuable insights into their social media campaigns, make data-driven decisions, and optimize their content strategy for maximum engagement and impact.
Related article : Marketing KPI: 25 Digital Marketing Key Performance Indicators for Sales & Marketing- Manager, Department, Examples
2. Retweets, Mentions, Replies
Retweets, Mentions, and Replies are engagement metrics specific to Twitter that help managers understand how their audience is interacting with their content on this platform.
Retweets: Retweets measure the number of times a tweet has been shared by users on Twitter. Retweets are similar to shares on other platforms and indicate that the content is valuable and shareable. Retweets help to amplify the reach of a tweet, allowing it to reach a larger audience.
Mentions: Mentions are a metric that measures the number of times a user has been tagged in a tweet by another user. Mentions are a powerful tool for engagement, as they allow users to interact directly with others and encourage conversation and feedback. Mentions can help to build relationships with customers and other users and increase the visibility and reach of a Twitter account.
Replies: Replies measure the number of user-generated replies to a tweet. Replies can provide valuable feedback and insights into how users are reacting to the content and can help managers gauge sentiment and response. Replies can also help to spark conversation and engagement and can be used to build relationships with customers and followers.
Overall, Retweets, Mentions, and Replies are essential metrics for managers to track on Twitter, as they provide valuable insights into how their audience is interacting with their content. By monitoring these metrics, managers can gain a better understanding of user behavior on Twitter, optimize their content strategy, and improve engagement rates.
Related article : Why KPIs Are Important: 10 Reason Key Performance Indicators Stands For? -Meaning, Examples ,Template
3. Click-through rates (CTR)
Click-through rate (CTR) is a metric that measures the number of clicks on a link within a post or ad, divided by the total number of impressions. CTR is an important metric for managers to track, as it provides insights into how effectively their social media content is driving traffic to their website or other landing pages.
A high CTR indicates that the content is engaging and relevant to the audience, and that the call-to-action is compelling enough to prompt users to take action. A low CTR, on the other hand, may indicate that the content is not resonating with the audience or that the call-to-action needs to be optimized.
By monitoring CTR, managers can gain insights into the effectiveness of their content strategy and make data-driven decisions to optimize their campaigns. For example, if a particular post has a high CTR, managers may want to replicate the elements of that post in future content. Conversely, if a post has a low CTR, managers may want to adjust the content or call-to-action to improve engagement rates.
Overall, CTR is an important metric for managers to track, as it helps to measure the impact and effectiveness of social media campaigns on driving traffic and conversions. By monitoring CTR, managers can optimize their content strategy and improve engagement rates, ultimately leading to better business outcomes.
Related article : Sales KPI: 28 Metrics for Sales Manager – Examples, Meaning, Template, Dashboard
4. Average engagement rate per post
The average engagement rate per post is a metric that measures the overall level of engagement generated by a brand’s social media content, typically over a specific period. This metric provides an overall picture of how well a brand’s social media strategy is resonating with its audience.
To calculate the average engagement rate per post, managers divide the total engagement generated by their social media posts (likes, comments, shares, etc.) by the total number of posts published during the time period. The result is a percentage that represents the average engagement rate per post.
This metric is important because it helps managers understand the overall impact of their social media content on their audience. A high engagement rate indicates that the content is resonating with the audience and driving conversations and interactions. A low engagement rate may indicate that the content needs to be adjusted to better meet the needs and preferences of the audience.
By tracking the average engagement rate per post, managers can identify trends and patterns in their social media strategy, and adjust their content and approach accordingly. For example, if they notice that certain types of posts consistently generate higher engagement rates, they may want to focus on creating more of this type of content in the future. Conversely, if they notice that certain types of posts consistently generate low engagement rates, they may want to adjust their content strategy to better align with their audience’s preferences.
Overall, the average engagement rate per post is an important metric for managers to track, as it helps them measure the effectiveness of their social media strategy in engaging and resonating with their audience. By monitoring this metric, managers can make data-driven decisions to optimize their content strategy and improve engagement rates over time.
Related article : Top 11 Important Training KPIs HR Managers Should Have
Reach Metrics
5. Impressions
Impressions are a metric that measures the total number of times a post or ad is displayed to users on a social media platform. An impression is counted each time a user sees the post or ad, regardless of whether they interact with it or not.
Impressions provide a measure of the potential reach of a social media post, as they indicate the number of users who have been exposed to the content. However, it’s important to note that impressions don’t measure actual engagement or interaction with the post – they simply indicate that the post was displayed on a user’s screen.
By tracking impressions, managers can gain insights into the overall reach of their social media content and campaigns. A high number of impressions can indicate that the content is being displayed to a large number of users, which is a positive indicator for brand awareness and exposure. However, a high number of impressions on their own does not necessarily indicate success, as the content may not be resonating with the audience or driving engagement.
To gain a more complete understanding of the impact of their social media campaigns, managers should combine impression data with engagement metrics such as likes, comments, shares, and click-through rates. By analyzing both impression data and engagement metrics, managers can gain a more complete understanding of the effectiveness of their social media campaigns and make data-driven decisions to optimize their strategy.
Overall, impressions are an important metric for managers to track, as they provide insights into the potential reach of their social media content. By combining impression data with other engagement metrics, managers can gain a more complete understanding of the impact of their social media campaigns and make data-driven decisions to optimize their strategy for success.
Related article : Top 20 HR KPI Metrics & Examples for Human Resource Manager, Executive, Department – HRMS
6. Reach
Reach is a social media KPI that measures the total number of unique users who have viewed a post or ad on a social media platform. Unlike impressions, reach counts each user only once, regardless of how many times they may have viewed the content.
Reach is an important metric for managers because it provides insights into the actual audience size of a social media post or campaign. By tracking reach, managers can gauge the effectiveness of their social media strategy in reaching their target audience.
A high reach is generally seen as a positive indicator, as it indicates that the content is being displayed to a large number of users. However, a high reach on its own does not necessarily indicate success. Managers need to analyze reach data in conjunction with other engagement metrics such as likes, comments, shares, and click-through rates to gain a more complete understanding of the impact of their social media campaigns.
Reach data can be segmented by different variables such as demographics, location, interests, and behavior to gain insights into the specific audience segments that are engaging with the content. This information can be used to optimize the content strategy and better target the desired audience.
It’s important to note that reach can be influenced by a number of factors such as the time of day the content is posted, the platform being used, and the type of content being shared. Therefore, it’s important for managers to monitor reach data over time and make data-driven decisions to optimize their social media strategy for success.
Overall, reach is an important social media KPI for managers to track, as it provides insights into the actual audience size of a social media post or campaign. By analyzing reach data in conjunction with other engagement metrics, managers can gain a more complete understanding of the impact of their social media campaigns and make data-driven decisions to optimize their strategy for success.
7. Follower growth rate
Follower growth rate is a social media KPI that measures the rate at which a social media account is gaining or losing followers over a given period of time. This metric is calculated by dividing the net change in followers by the total number of followers at the beginning of the period and multiplying by 100 to get a percentage.
Follower growth rate is an important metric for managers because it provides insights into the effectiveness of their social media strategy in attracting and retaining followers. A high follower growth rate indicates that the content being shared is resonating with the audience and driving new followers to the account. On the other hand, a low or negative follower growth rate may indicate that the content being shared is not resonating with the audience or that there are issues with the social media strategy that need to be addressed.
It’s important to note that follower growth rate should be tracked over time to gain insights into trends and changes in the audience. A high follower growth rate in one month may not necessarily indicate long-term success if the trend is not sustained over time.
To optimize follower growth rate, managers can analyze data on the types of content that are driving the most engagement and adjust their social media strategy accordingly. For example, if posts that include video content are driving more engagement than posts with images, managers can prioritize video content in their social media strategy.
Overall, follower growth rate is an important social media KPI for managers to track as it provides insights into the effectiveness of their social media strategy in attracting and retaining followers. By analyzing follower growth rate data over time and making data-driven decisions to optimize their social media strategy, managers can achieve long-term success in building a strong and engaged social media audience.
8. Unique visitors
Unique visitors is a social media KPI that measures the number of individual users who have visited a social media page or account during a specific period of time. Unique visitors are different from page views, as they count each user only once, regardless of how many times they may have visited the page.
Unique visitors is an important metric for managers because it provides insights into the size and reach of their social media audience. By tracking unique visitors over time, managers can gauge the effectiveness of their social media strategy in attracting and retaining visitors to their social media pages or accounts.
This metric can be particularly useful for managers who are looking to expand their audience or reach new segments of their target audience. By analyzing data on unique visitors, managers can gain insights into the demographics, interests, and behaviors of their social media audience and adjust their social media strategy accordingly.
For example, if a manager notices that there is a high number of unique visitors from a particular geographic region or age group, they may want to tailor their content to better appeal to that audience. Alternatively, if a manager notices a low number of unique visitors, they may want to evaluate their social media strategy and make changes to better reach their target audience.
Overall, unique visitors is an important social media KPI for managers to track as it provides insights into the size and reach of their social media audience. By analyzing data on unique visitors over time and making data-driven decisions to optimize their social media strategy, managers can achieve long-term success in building a strong and engaged social media audience.
9. Viral reach
Viral reach is a social media KPI that measures the number of people who were exposed to a social media post through sharing and reposting by other users, rather than through paid advertising or organic reach. Viral reach is a key indicator of the viral potential of a piece of content, as it shows how many people were reached beyond the account’s existing followers.
Viral reach is an important metric for managers because it measures the organic spread and impact of their content on social media. A high viral reach can indicate that the content is resonating with the audience and has the potential to go viral and reach a much larger audience. On the other hand, a low viral reach may indicate that the content is not engaging enough or not being shared by the audience.
To optimize viral reach, managers can analyze data on the types of content that are driving the most engagement and sharing, and adjust their social media strategy accordingly. For example, if posts that include user-generated content are driving more engagement and sharing than posts with branded content, managers can prioritize user-generated content in their social media strategy.
It’s important to note that viral reach can be unpredictable, and not all content will go viral. However, by tracking viral reach over time and analyzing trends, managers can gain insights into what types of content have the potential to go viral and adjust their social media strategy accordingly.
Overall, viral reach is an important social media KPI for managers to track as it provides insights into the organic spread and impact of their content on social media. By analyzing data on viral reach and making data-driven decisions to optimize their social media strategy, managers can achieve long-term success in building a strong and engaged social media audience.
Related article : KPI Scorecards : Track Your Business Performance – Meaning , Template ,Dashboards , Examples

Conversion Metrics
10. Conversion rate
Conversion rate is a social media KPI that measures the percentage of users who complete a desired action after clicking on a call-to-action (CTA) on a social media post or ad. The desired action can vary depending on the goal of the campaign, such as making a purchase, signing up for a newsletter, or filling out a contact form.
Conversion rate is an important metric for managers because it shows the effectiveness of their social media campaigns in driving actions that align with their business goals. By tracking conversion rates over time, managers can gauge the success of their campaigns and make data-driven decisions to optimize their social media strategy.
To improve conversion rates, managers can analyze data on user behavior and adjust their social media strategy accordingly. For example, if a particular CTA is not driving conversions, managers may want to test different CTAs or adjust the messaging to better align with the audience’s needs and interests.
It’s important to note that conversion rates can be influenced by a variety of factors, such as the quality of the landing page, the ease of the checkout process, and the overall user experience. Therefore, managers should also track other conversion-related metrics, such as bounce rate and time on site, to gain a deeper understanding of the user journey and make data-driven decisions to improve conversion rates.
Overall, conversion rate is an important social media KPI for managers to track as it provides insights into the effectiveness of their social media campaigns in driving actions that align with their business goals. By analyzing data on conversion rates and making data-driven decisions to optimize their social media strategy, managers can achieve long-term success in driving conversions and increasing ROI.
11. Cost per conversion
Cost per conversion is a social media KPI that measures the cost of acquiring a customer or lead through a social media campaign. It is calculated by dividing the total cost of the campaign by the number of conversions.
Cost per conversion is an important metric for managers because it shows the cost-effectiveness of their social media campaigns in achieving their business goals. By tracking cost per conversion over time, managers can compare the cost-effectiveness of different campaigns and make data-driven decisions to optimize their social media strategy.
To improve cost per conversion, managers can analyze data on the performance of their campaigns and adjust their social media strategy accordingly. For example, if a campaign is not achieving the desired number of conversions, managers may want to test different targeting options or adjust the ad creative to better resonate with the target audience.
It’s important to note that the cost per conversion can vary depending on the goal of the campaign and the value of the conversion to the business. For example, a campaign that aims to drive newsletter sign-ups may have a lower cost per conversion than a campaign that aims to drive product purchases.
Overall, cost per conversion is an important social media KPI for managers to track as it provides insights into the cost-effectiveness of their social media campaigns in achieving their business goals. By analyzing data on cost per conversion and making data-driven decisions to optimize their social media strategy, managers can achieve long-term success in driving conversions and increasing ROI.
12. Customer lifetime value (CLTV)
Customer lifetime value (CLTV) is a social media KPI that measures the total value a customer brings to a business over the course of their relationship. It takes into account the amount of money the customer spends on products or services, as well as the length of time they remain a customer.
CLTV is an important metric for managers because it shows the long-term value of a customer and helps them make data-driven decisions to optimize their social media strategy. By tracking CLTV over time, managers can identify which social media campaigns and tactics are most effective in acquiring and retaining high-value customers.
To calculate CLTV, managers can use the following formula:
CLTV = (Average purchase value x Number of repeat purchases per year x Average customer lifespan)
By analyzing data on CLTV, managers can gain insights into the effectiveness of their social media campaigns in driving customer acquisition, retention, and loyalty. For example, if the CLTV of customers acquired through a particular social media campaign is lower than the average CLTV, managers may want to adjust their targeting or messaging to attract higher-value customers.
It’s important to note that CLTV can be influenced by a variety of factors, such as the quality of the product or service, the level of customer service, and the overall customer experience. Therefore, managers should also track other customer-related metrics, such as customer satisfaction and Net Promoter Score, to gain a deeper understanding of the customer journey and make data-driven decisions to improve CLTV.
Overall, CLTV is an important social media KPI for managers to track as it provides insights into the long-term value of their customers and helps them make data-driven decisions to optimize their social media strategy. By analyzing data on CLTV and making data-driven decisions to acquire and retain high-value customers, managers can achieve long-term success in driving revenue and increasing ROI.
13. Return on investment (ROI)
Return on investment (ROI) is a social media KPI that measures the financial return generated by a social media campaign compared to the cost of the campaign. It is calculated by dividing the revenue generated by the campaign by the cost of the campaign and expressed as a percentage.
ROI is an important metric for managers because it shows the profitability of their social media campaigns and helps them make data-driven decisions to optimize their social media strategy. By tracking ROI over time, managers can identify which social media campaigns and tactics are most effective in generating revenue and increasing profitability.
To calculate ROI, managers can use the following formula:
ROI = ((Revenue – Cost) / Cost) x 100%
By analyzing data on ROI, managers can gain insights into the effectiveness of their social media campaigns in generating revenue and driving business outcomes. For example, if the ROI of a particular social media campaign is lower than the desired target, managers may want to adjust their targeting or messaging to improve the conversion rate and increase revenue.
It’s important to note that ROI can be influenced by a variety of factors, such as the quality of the product or service, the level of customer service, and the overall customer experience. Therefore, managers should also track other customer-related metrics, such as customer satisfaction and Net Promoter Score, to gain a deeper understanding of the customer journey and make data-driven decisions to improve ROI.
Overall, ROI is an important social media KPI for managers to track as it provides insights into the financial return generated by their social media campaigns and helps them make data-driven decisions to optimize their social media strategy. By analyzing data on ROI and making data-driven decisions to increase revenue and profitability, managers can achieve long-term success in driving business outcomes and increasing ROI.
14. Leads generated
Leads generated is a social media KPI that measures the number of potential customers who have shown interest in a product or service through a social media campaign. A lead is usually defined as a person who has provided their contact information or expressed interest in a product or service in some way, such as filling out a form, subscribing to a newsletter, or requesting a quote.
Lead generation is an important social media KPI for managers because it shows how effective their social media campaigns are in driving business outcomes. By tracking leads generated over time, managers can identify which campaigns and tactics are most effective in attracting potential customers and increasing revenue.
To measure leads generated, managers can use a variety of tools, such as Google Analytics or social media management platforms, to track how many people have filled out a form, subscribed to a newsletter, or taken other actions that indicate interest in a product or service. This data can then be analyzed to determine the conversion rate of the campaign, which is the percentage of people who took the desired action compared to the total number of people who viewed the campaign.
By analyzing data on leads generated, managers can gain insights into the effectiveness of their social media campaigns in attracting potential customers and driving business outcomes. For example, if a particular social media campaign has a low conversion rate, managers may want to adjust their targeting or messaging to improve the effectiveness of the campaign.
Overall, leads generated is an important social media KPI for managers to track as it provides insights into the effectiveness of their social media campaigns in driving business outcomes. By analyzing data on leads generated and making data-driven decisions to improve the effectiveness of their campaigns, managers can achieve long-term success in generating leads and increasing revenue.
Branding Metrics
15. Brand mentions
Brand mentions is a social media KPI that measures the number of times a brand name or related keywords are mentioned on social media platforms. This metric is an important indicator of the brand’s reputation and visibility on social media.
Tracking brand mentions is important for managers because it allows them to monitor how their brand is being perceived and talked about on social media. By tracking this metric, managers can identify opportunities to engage with their audience, respond to negative comments, and amplify positive sentiment around their brand.
To track brand mentions, managers can use social media monitoring tools that allow them to monitor keywords and hashtags related to their brand. These tools can provide real-time alerts when the brand is mentioned on social media, allowing managers to quickly respond to any comments or feedback.
By analyzing data on brand mentions over time, managers can also gain insights into the effectiveness of their branding efforts on social media. For example, if a brand sees a significant increase in brand mentions after launching a new social media campaign, it may indicate that the campaign was successful in increasing brand awareness and visibility.
Overall, tracking brand mentions is an important social media KPI for managers as it allows them to monitor their brand’s reputation and visibility on social media. By using social media monitoring tools and analyzing data on brand mentions, managers can identify opportunities to engage with their audience, respond to feedback, and improve their overall branding efforts on social media.
Related article : Customer Service KPI: 20 Metrics To Measure Team Performance – Meaning, Examples, Templates, and Dashboard
16. Brand sentiment
Brand sentiment is a social media KPI that measures the overall sentiment or attitude towards a brand on social media. It involves analyzing the tone, language, and context of social media posts and comments related to the brand to determine whether the sentiment is positive, negative, or neutral.
Tracking brand sentiment is important for managers because it allows them to monitor how their brand is being perceived on social media and identify areas where they may need to improve their brand reputation. By tracking this metric, managers can gain insights into customer feedback and opinions, and use this information to improve their overall branding and marketing strategies.
To measure brand sentiment, managers can use social media listening and monitoring tools that analyze social media posts and comments related to their brand. These tools use sentiment analysis algorithms to classify posts and comments as positive, negative, or neutral based on the language and tone used in the text.
By analyzing data on brand sentiment over time, managers can gain insights into the effectiveness of their branding and marketing strategies. For example, if a brand sees a significant increase in negative sentiment after a new product launch or marketing campaign, it may indicate that the campaign was not well received by customers and needs to be adjusted.
Overall, tracking brand sentiment is an important social media KPI for managers as it allows them to monitor their brand reputation on social media and make data-driven decisions to improve their branding and marketing strategies. By using social media listening and monitoring tools, managers can gain insights into customer feedback and opinions, and use this information to improve their overall brand sentiment and reputation.
17. Share of voice
Share of voice (SOV) is a social media KPI that measures the percentage of online conversations related to a particular brand, product, or service in comparison to the total number of conversations related to that industry or category.
By tracking share of voice, managers can gain insights into how much their brand is being talked about on social media in comparison to their competitors. It provides a benchmark for evaluating the brand’s overall online presence and allows managers to identify areas where they may need to increase their social media activity to improve their share of voice.
To calculate share of voice, managers can use social media listening and monitoring tools to track the number of online conversations related to their brand, product, or service, as well as the number of conversations related to their competitors. These tools use algorithms to identify and track online conversations based on keywords, hashtags, and other relevant terms.
Once the total number of online conversations for the brand and competitors have been identified, managers can calculate the share of voice by dividing the total number of brand-related conversations by the total number of industry or category-related conversations.
For example, if there were 100 online conversations related to a particular brand and 500 online conversations related to the overall industry or category, the share of voice for that brand would be 20% (100/500).
By tracking share of voice over time, managers can gain insights into the effectiveness of their social media strategies and make data-driven decisions to improve their overall online presence. They can use this information to identify trends and patterns in social media conversations, as well as to evaluate the success of their marketing campaigns and brand awareness efforts.
18. Social listening score
Social listening score is a social media KPI that measures a brand’s ability to listen to and engage with its audience on social media. It is a measure of how well a brand monitors and responds to online conversations related to its products, services, or industry.
Social listening involves monitoring social media platforms for mentions of a brand, its products or services, competitors, and industry-related topics. By analyzing these conversations, brands can gain valuable insights into their audience’s needs, preferences, and opinions.
Social listening score is calculated by analyzing how effectively a brand is engaging with its audience on social media. This includes metrics such as response time, response rate, and sentiment analysis.
Response time measures the speed at which a brand responds to customer inquiries or complaints on social media. The faster the response time, the higher the social listening score.
Response rate measures the percentage of customer inquiries or complaints that are responded to on social media. Brands with a higher response rate have a higher social listening score.
Sentiment analysis measures the tone of online conversations related to a brand, product, or service. By analyzing the sentiment of online conversations, brands can gain insights into how their audience perceives them. Brands with a higher positive sentiment score have a higher social listening score.
By tracking social listening score over time, brands can gain insights into their audience’s needs, preferences, and opinions. They can use this information to improve their products, services, and marketing strategies to better serve their customers. Additionally, a higher social listening score can lead to increased brand loyalty and positive word-of-mouth marketing.

Customer Metrics
19. Customer satisfaction score (CSAT)
Customer satisfaction score (CSAT) is a social media KPI that measures how satisfied customers are with a brand’s products, services, or customer service. It is an important metric for measuring customer loyalty and identifying areas for improvement.
CSAT is typically measured through surveys or feedback forms that ask customers to rate their level of satisfaction with a brand on a scale of 1-5 or 1-10. The average score is then calculated to determine the overall CSAT score.
A high CSAT score indicates that a brand is meeting or exceeding customer expectations, while a low score indicates that improvements are needed. Brands can use CSAT scores to identify areas where they need to improve their products or services and to measure the impact of customer service initiatives.
CSAT scores can also be used to identify trends in customer satisfaction over time. For example, if CSAT scores are declining, it may indicate that customers are becoming less satisfied with a brand’s products or services.
By tracking CSAT scores, brands can improve their customer retention and loyalty, leading to increased sales and revenue. Additionally, a high CSAT score can lead to positive word-of-mouth marketing, as satisfied customers are more likely to recommend a brand to their friends and family.
Related article : KPI In Project Management : KPIs In Agile For Planning Project Management – A Consultant’s Guide With Examples
20. Net promoter score (NPS)
Net Promoter Score (NPS) is a social media KPI that measures how likely customers are to recommend a brand to others. It is a widely used metric for assessing customer loyalty and brand advocacy.
The NPS survey typically asks customers to rate, on a scale of 0-10, how likely they are to recommend a brand to others. Based on the responses, customers are divided into three categories: Promoters (those who gave a rating of 9 or 10), Passives (those who gave a rating of 7 or 8), and Detractors (those who gave a rating of 0-6).
The NPS is then calculated by subtracting the percentage of Detractors from the percentage of Promoters. The resulting score can range from -100 (if all respondents are Detractors) to +100 (if all respondents are Promoters).
A high NPS indicates that a brand has a strong base of loyal customers who are likely to recommend the brand to others, while a low NPS may indicate that a brand has work to do in building customer loyalty and advocacy.
By tracking NPS scores over time, brands can identify trends in customer loyalty and advocacy, and assess the impact of marketing and customer service initiatives on brand perception. Additionally, a high NPS can lead to increased customer retention and revenue, as loyal customers are more likely to continue doing business with a brand and recommend it to others.
21. Customer retention rate
Customer Retention Rate is a social media KPI that measures the percentage of customers who continue to do business with a company over a period of time. It is a critical metric for assessing the effectiveness of a brand’s customer retention strategies and its overall customer loyalty.
To calculate the customer retention rate, a company must first determine the number of customers at the beginning of a given period, and the number of customers at the end of that period. The retention rate is then calculated by dividing the number of customers at the end of the period by the number of customers at the beginning of the period, and multiplying the result by 100.
For example, if a company had 100 customers at the beginning of a month and 90 customers at the end of the month, the customer retention rate for that month would be 90/100 x 100 = 90%.
A high customer retention rate indicates that a company is successful in keeping its existing customers satisfied and engaged, which can lead to increased revenue through repeat purchases and positive word-of-mouth referrals. On the other hand, a low customer retention rate can be a warning sign that a company’s customer service or product quality may be lacking.
By tracking customer retention rates over time, brands can identify trends in customer loyalty and assess the effectiveness of their customer retention strategies. This can help them make informed decisions about how to allocate resources towards customer retention initiatives and improve their overall customer experience.
22. Customer acquisition cost (CAC)
Customer Acquisition Cost (CAC) is a social media KPI that measures the total cost of acquiring a new customer. This metric includes all the marketing and sales expenses associated with attracting and converting a prospect into a paying customer.
To calculate the CAC, a company must first add up all the costs associated with their marketing and sales efforts during a specific period, such as a month or a quarter. This might include the cost of running social media ads, producing content, attending events, or hiring salespeople. Next, the company must determine the total number of new customers acquired during that same period. The CAC is then calculated by dividing the total marketing and sales costs by the number of new customers acquired.
For example, if a company spends $50,000 on marketing and sales efforts in a given month and acquires 100 new customers during that same period, the CAC would be $500 per new customer.
By tracking the CAC over time, companies can assess the effectiveness of their marketing and sales strategies and determine which channels and tactics are generating the highest return on investment. A low CAC is generally a good indicator that a company’s marketing and sales efforts are efficient and effective, while a high CAC may indicate that the company needs to make changes to their strategy to improve their conversion rates or reduce their marketing costs.
By optimizing their customer acquisition cost, companies can improve their profitability and scale their business more effectively, while also ensuring that they are targeting the right audience and delivering value to their customers.
Related Article : SMART KPI : What Is Smart KPIs And How To Use It In Business – Meaning , Examples, Dashboard And Template.

Social Media Platforms
KPIs specific to each social media platform, including Facebook, Twitter, Instagram, LinkedIn, and TikTok.
- Facebook:
- Page likes: measures the number of people who like your Facebook page and opt-in to receive your updates.
- Post reach: measures how many people have seen your Facebook posts.
- Engagement rate: measures the percentage of people who have engaged with your Facebook posts, such as by liking, commenting, or sharing.
- Click-through rate: measures the percentage of people who have clicked on a link in your Facebook post or ad.
- Twitter:
- Followers: measures the number of people who follow your Twitter account.
- Impressions: measures how many times your tweets have been seen by Twitter users.
- Retweets: measures how many times your tweets have been retweeted by other Twitter users.
- Replies: measures how many times other Twitter users have replied to your tweets.
- Instagram:
- Followers: measures the number of people who follow your Instagram account.
- Impressions: measures how many times your posts have been seen by Instagram users.
- Likes: measures how many people have liked your Instagram posts.
- Comments: measures how many people have commented on your Instagram posts.
- LinkedIn:
- Followers: measures the number of people who follow your LinkedIn page.
- Impressions: measures how many times your LinkedIn posts have been seen by LinkedIn users.
- Click-through rate: measures the percentage of people who have clicked on a link in your LinkedIn post or ad.
- Social selling index: measures how well you are leveraging your professional brand to find and engage with potential customers on LinkedIn.
- TikTok:
- Followers: measures the number of people who follow your TikTok account.
- Views: measures how many times your TikTok videos have been viewed by TikTok users.
- Shares: measures how many times your TikTok videos have been shared by other TikTok users.
- Engagement rate: measures the percentage of people who have engaged with your TikTok videos, such as by liking, commenting, or sharing.
By tracking these KPIs on each social media platform, managers can gain a better understanding of how their social media campaigns are performing and make informed decisions about where to allocate their resources for maximum impact.
Related article : What Is A KPI & How To Develop It Effectively

Tools for Tracking Social Media KPIs
In order to effectively track social media KPIs, managers can use a variety of social media analytics tools. These tools can help them monitor, measure, and analyze social media activity to gain insights into the performance of their social media marketing campaigns. Here are some popular social media analytics tools that managers can use:
Google Analytics: This is a free analytics tool that can be used to track website traffic and user behavior. Managers can use it to track traffic from social media platforms and measure how much traffic converts into leads or sales.
Hootsuite Insights: Hootsuite is a social media management platform that also offers a suite of analytics tools. Its Insights tool can be used to track and measure social media activity across multiple platforms, including Facebook, Twitter, Instagram, and LinkedIn.
Sprout Social: Sprout Social is another social media management platform that includes a suite of analytics tools. Its analytics dashboard provides real-time insights into social media activity, including engagement rates, follower growth, and audience demographics.
Brandwatch: Brandwatch is a social media listening and analytics tool that can be used to monitor and analyze social media conversations across multiple platforms. It can help managers track brand mentions, sentiment, and share of voice.
Buffer Analyze: Buffer Analyze is a social media analytics tool that can be used to track and measure social media activity across multiple platforms, including Facebook, Instagram, Twitter, and LinkedIn. It provides insights into engagement rates, follower growth, and audience demographics.
Mention: Mention is a social media listening and analytics tool that can be used to monitor and analyze social media activity across multiple platforms. It can help managers track brand mentions, sentiment, and share of voice.
By using these social media analytics tools, managers can track and measure their social media KPIs more effectively, gain insights into the performance of their social media campaigns, and make data-driven decisions to improve their social media marketing strategies.
Related article : How To Create A Marketing KPI Dashboard
How Performance Management Software Helps to Manage Social Media KPIs
DoerHRM – In today’s digital age, social media has become an essential part of every company’s marketing strategy. Social media managers are responsible for creating engaging content, building brand awareness, and driving traffic to their company’s website. With so much at stake, it’s crucial for social media managers to track and measure the success of their campaigns using key performance indicators (KPIs). However, manually tracking these KPIs can be time-consuming and prone to errors. That’s where performance management software like DoerHRM comes in. DoerHRM is an all-in-one HR and performance management software that helps businesses manage their workforce and streamline their HR processes. One of the features of DoerHRM is its ability to track social media KPIs for managers. This feature helps social media managers to save time and effort while accurately tracking their KPIs.
With DoerHRM, managers can easily track and analyze a variety of social media KPIs, such as engagement metrics, reach metrics, conversion metrics, branding metrics, and customer metrics. This information can be used to make data-driven decisions and optimize social media strategies to increase ROI.
DoerHRM’s social media KPI tracking feature also allows managers to compare their performance against industry benchmarks, competitors, and their own historical data. By doing so, managers can identify areas where they need to improve and make changes to their social media strategy accordingly.
Moreover, DoerHRM’s social media KPI tracking feature also enables managers to create customizable reports that can be shared with team members and stakeholders. These reports can help managers showcase the impact of their social media campaigns and provide insights into their social media strategy’s effectiveness.
In addition to tracking social media KPIs, DoerHRM’s performance management software also provides other HR-related features, such as time and attendance tracking, employee performance evaluation, goal setting, and more. This all-in-one solution can help businesses streamline their HR processes and improve their workforce’s performance.
Conclusion
In conclusion, tracking KPIs is essential for managers to measure the success of their social media marketing strategies. The metrics discussed in this article, including engagement, reach, conversion, branding, and customer metrics, provide valuable insights into the performance of social media campaigns. Each social media platform has its own set of KPIs that managers should track to optimize their strategy. It is crucial for managers to use social media analytics tools to gather and analyze data effectively. By prioritizing KPI tracking, managers can make data-driven decisions and improve their social media marketing campaigns’ overall performance, resulting in increased engagement, brand awareness, and customer acquisition.