The success of any business depends on the effectiveness of its sales kpi in the sales team. Sales managers play a crucial role in managing and guiding their teams toward achieving the company’s revenue goals. To measure the performance of their sales team, managers rely on key performance indicators (KPIs). Sales KPIs are metrics used to track the performance of sales reps, measure the effectiveness of sales strategies, and identify areas for improvement.
In this article, we will explore 30 essential sales KPIs that sales managers can use to measure their team’s performance. We will discuss the examples and meanings of each KPI, providing a comprehensive guide to help sales managers understand how to measure, track, and analyze their team’s performance. Additionally, we will provide templates and dashboard tools that sales managers can use to visualize their data and make informed decisions.
By using sales KPIs, sales managers can identify their team’s strengths and weaknesses, optimize their sales process, and improve their sales strategy. Furthermore, sales KPIs can help managers set realistic goals and track their progress towards achieving them. With this knowledge, sales managers can make data-driven decisions, resulting in increased revenue and a more effective sales team.
Contents
Definition of Sales KPIs
Sales KPIs, or key performance indicators, are metrics that sales managers use to track the performance of their sales team and evaluate the effectiveness of their sales strategies. KPIs can help sales managers to understand how their team is performing against specific targets, such as sales revenue, lead generation, or conversion rates.
Sales KPIs can be both quantitative and qualitative in nature, measuring both financial and non-financial aspects of a company’s sales performance. Examples of quantitative KPIs include sales revenue, average deal size, and conversion rates, while qualitative KPIs may include customer satisfaction, sales team morale, and employee turnover rates.
Sales KPIs are important because they help managers to make data-driven decisions, rather than relying on assumptions or guesswork. By tracking and analyzing sales data, managers can identify areas for improvement and adjust their sales strategies accordingly. They can also use KPIs to set performance targets for their sales team and motivate them to achieve better results.
Overall, sales KPIs are an essential tool for any sales manager who wants to improve their team’s performance and drive business growth. By using KPIs effectively, sales managers can gain valuable insights into their team’s performance and take action to optimize their sales process and strategy.
Related article : What is a Key Performance Indicator (KPI)? Meaning, Templates, Examples
Importance of Sales KPIs for Sales Managers
Sales KPIs are crucial for sales managers for a number of reasons.
Firstly, KPIs help managers to set clear and measurable goals for their sales team. Without defined targets, it can be difficult for sales reps to know what they are working towards, leading to confusion and lack of direction. KPIs provide a clear framework for sales reps to understand what is expected of them and to work towards achieving specific targets.
Secondly, KPIs help managers to evaluate the performance of their sales team. By tracking KPIs such as sales revenue, conversion rates, and average deal size, managers can quickly identify areas where their team is excelling and areas where they need to improve. This information can then be used to adjust sales strategies, provide training and support, and make other changes to optimize sales performance.
Thirdly, KPIs can be used to motivate sales reps to perform at their best. When sales reps have clear targets to work towards and can see their progress towards those targets, they are more likely to feel motivated and engaged in their work. This, in turn, can lead to increased productivity and better sales results.
Finally, KPIs can help managers to make data-driven decisions about their sales strategies. By analyzing KPI data, managers can identify patterns and trends in their sales performance, allowing them to make informed decisions about how to optimize their sales process and strategy.
Overall, sales KPIs are essential for sales managers who want to improve their team’s performance and drive business growth. By setting clear targets, evaluating performance, motivating sales reps, and making data-driven decisions, managers can optimize their sales strategy and achieve better results.
Key Metrics for Sales Managers

Revenue-based Sales KPI
1. Sales Revenue
Sales Revenue is the total amount of money generated from sales within a given period. It is one of the most common and fundamental KPIs for sales managers, as it directly reflects the overall success of the sales team in generating revenue for the company. Sales revenue can be measured on a daily, weekly, monthly, quarterly, or annual basis, depending on your business’s sales cycle and goals.
Example
This KPI measures the total amount of money generated from sales within a given period. It is an essential metric for evaluating the overall performance of a company’s sales efforts.
Example: A company generated $500,000 in sales revenue in the first quarter of the year.
Related article : Top 11 Important Training KPIs HR Managers Should Have
2. Sales Growth Rate
Sales Growth Rate is the percentage increase or decrease in sales revenue over a specific period. It is an important KPI for sales managers to track as it indicates whether the sales team is growing the business or not. The sales growth rate can be calculated monthly, quarterly, or annually, depending on the business’s sales cycle.
Example
This KPI measures the percentage increase or decrease in sales revenue from a previous period. It helps assess the company’s growth over time and identify areas that require improvement.
Example: A company’s sales grew by 15% in the second quarter compared to the first quarter.
Related article : Why KPIs Are Important: 10 Reason Key Performance Indicators Stands For? -Meaning, Examples ,Template
3. Gross Profit Margin
Gross Profit Margin is the percentage of revenue that remains after deducting the cost of goods sold. It is an essential metric for sales managers as it reflects the company’s profitability. A higher gross profit margin indicates that the sales team is generating revenue while keeping the costs low, thus contributing to the company’s profitability.
Example
This KPI measures the percentage of revenue remaining after deducting the cost of goods sold. It indicates the profitability of a company’s sales efforts.
Example: A company’s gross profit margin is 25%, meaning that it retains $0.25 for every $1 of revenue generated.
Related article : Marketing KPI: 25 Digital Marketing Key Performance Indicators for Sales & Marketing- Manager, Department, Examples
4. Average Purchase Value
Average Purchase Value is the average amount of money spent by customers per transaction. It is an important KPI for sales managers to track as it indicates the level of customer engagement and loyalty. A higher average purchase value indicates that customers are willing to spend more money on the company’s products or services, which is a positive sign for the business.
Example
This KPI measures the average amount spent by a customer on a single purchase. It helps assess the buying behavior of customers.
Example: A company’s average purchase value is $50, meaning that customers spend an average of $50 per purchase.
Related article : IT KPI : 25 Key Performance Indicator for IT Managers – Meaning ,Dashboard and Examples
5. Customer Lifetime Value
Customer Lifetime Value (CLV) is the estimated amount of money a customer will spend on the company’s products or services over their lifetime. It is an important KPI for sales managers as it helps them to understand the long-term value of their customers. A higher CLV indicates that the company is attracting and retaining valuable customers, which is essential for the business’s growth.
Example
This KPI predicts the revenue generated by a customer over their lifetime. It helps identify high-value customers and develop strategies to retain them.
Example: A company’s average customer lifetime value is $500, meaning that a customer is expected to generate $500 in revenue throughout their lifetime.
Related article : SMART KPI : What Is Smart KPIs and How to Use It In Business – Meaning , Examples, Dashboard and Template
6. Customer Acquisition Cost
Customer Acquisition Cost (CAC) is the amount of money spent by the company to acquire a new customer. It is an important KPI for sales managers as it reflects the effectiveness of their sales and marketing efforts. A lower CAC indicates that the sales team is acquiring customers at a lower cost, which is beneficial for the company’s profitability.
Example
This KPI measures the total cost of acquiring a new customer. It helps assess the efficiency of a company’s sales and marketing efforts.
Example: A company spent $1000 on sales and marketing activities to acquire 10 new customers, making the customer acquisition cost $100 per customer.
Related article : Social Media KPIs for Managers : 25 Metrics You Should Be Tracking for Your Marketing Strategy
7. Sales by Product/Service
Sales by Product/Service is the amount of revenue generated by each product or service offered by the company. It is an important KPI for sales managers as it helps them to understand the popularity of each product or service among their customers. This information can be used to make strategic decisions about product development and marketing
Example
This KPI measures the revenue generated by each product/service offered by the company. It helps identify the top-selling products/services.
Example: A company’s top-selling product generated $200,000 in revenue in the second quarter.
Relate article: KPI for Finance Department: 26 Essential Metrics to Monitor for Finance Manager with Examples
8. Sales by Geography
Sales by Geography is the amount of revenue generated by each geographic region where the company operates. It is an important KPI for sales managers as it helps them to identify areas where the company is performing well or needs improvement. This information can be used to make strategic decisions about sales and marketing efforts in different regions.
Example
This KPI measures the revenue generated by different geographic regions. It helps identify the regions that generate the most revenue and those that require more attention.
Example: A company generated $100,000 in revenue from North America, $50,000 from Europe, and $25,000 from Asia in the first quarter.
Related article : Practical KPI Examples
9. Sales by Customer Type:
Sales by Customer Type is the amount of revenue generated by different types of customers, such as new customers, repeat customers, or high-value customers. It is an important KPI for sales managers as it helps them to understand the sales performance of each customer segment. This information can be used to make strategic decisions about customer acquisition and retention strategies.
Example
This KPI measures the revenue generated by different types of customers, such as new customers, returning customers, or high-value customers. It helps identify the most profitable customer segments.
Example: A company generated $150,000 in revenue from new customers and $350,000 from returning customers in the second quarter.
Related article : Customer Service KPI: 20 Metrics To Measure Team Performance – Meaning, Examples, Templates, and Dashboard

Activity-based Sales KPI
10. Sales Calls
Sales Calls are the number of calls made by the sales team to potential and existing customers. It is an important KPI for sales managers as it reflects the level of activity of the sales team. The number of sales calls made can be tracked daily, weekly, or monthly, depending on the business’s sales cycle and goals.
Example
Sales Calls: This KPI measures the number of calls made by sales reps. It helps assess the effectiveness of a company’s outbound sales efforts.
Example: A sales rep made 50 calls in a day.
Related article : KPI In Project Management : KPIs In Agile For Planning Project Management – A Consultant’s Guide With Examples
11. Email Open Rates
Email Open Rates is the percentage of emails opened by recipients out of the total number of emails sent. It is an important KPI for sales managers as it reflects the effectiveness of their email marketing campaigns. A higher email open rate indicates that the email subject lines and content are engaging, and the sales team is targeting the right audience.
Example
This KPI measures the percentage of recipients who open sales emails. It helps assess the effectiveness of email marketing efforts.
Example: A company’s email open rate is 20%, meaning that 20% of the recipients opened the sales email.
Related article : What Is A KPI & How To Develop It Effectively
12. Email Response Rates
Email Response Rates is the percentage of replies received by the sales team out of the total number of emails sent. It is an important KPI for sales managers as it reflects the effectiveness of their email communication with potential and existing customers. A higher email response rate indicates that the sales team is communicating effectively with the customers and addressing their queries and concerns.
Example
This KPI measures the percentage of recipients who respond to sales emails. It helps assess the effectiveness of email marketing efforts.
Example: A company’s email response rate is 10%, meaning that 10% of the recipients responded to the sales email.
Related article : How To Create A Marketing KPI Dashboard
13. Lead Response Time
Lead Response Time is the time taken by the sales team to respond to a lead generated by marketing or other sources. It is an important KPI for sales managers as it reflects the level of customer service provided by the sales team. A faster lead response time indicates that the sales team is proactive and responsive, which can help in converting more leads into customers.
Example
This KPI measures the average time taken to respond to a lead. It helps assess the speed and efficiency of a company’s lead follow-up process.
Example: A company’s lead response time is 2 hours, meaning that it takes an average of 2 hours to respond to a lead.
14. Lead-to-Opportunity Conversion Rate
Lead-to-Opportunity Conversion Rate is the percentage of leads that are converted into opportunities. It is an important KPI for sales managers as it reflects the effectiveness of their lead generation and qualification process. A higher lead-to-opportunity conversion rate indicates that the sales team is targeting the right audience and effectively communicating the value proposition of the company’s products or services.
Example
This KPI measures the percentage of leads that turn into opportunities. It helps assess the quality of the leads and the effectiveness of the sales team in converting leads into opportunities.
Example: A company’s lead-to-opportunity conversion rate is 20%, meaning that 20% of the leads turn into opportunities.
15. Opportunity-to-Win Ratio
Opportunity-to-Win Ratio is the percentage of opportunities that are converted into sales. It is an important KPI for sales managers as it reflects the effectiveness of their sales process. A higher opportunity-to-win ratio indicates that the sales team is effectively closing deals and generating revenue for the company.
Example
This KPI measures the percentage of opportunities that turn into sales. It helps assess the effectiveness of the sales team in closing deals.
Example: A company’s opportunity-to-win ratio is 30%, meaning that 30% of the opportunities turn into sales.
16. Sales Cycle Length
Sales Cycle Length is the time taken by the sales team to close a deal from the initial contact with the customer to the final sale. It is an important KPI for sales managers as it reflects the efficiency of their sales process. A shorter sales cycle length indicates that the sales team is effective in closing deals and generating revenue for the company.
Example
This KPI measures the average time taken to close a sale. It helps assess the efficiency of the sales process and identify areas that require improvement.
Example: A company’s sales cycle length is 60 days, meaning that it takes an average of 60 days to close a sale.
17. Sales Pipeline Coverage
.Sales Pipeline Coverage is the amount of revenue in the sales pipeline compared to the revenue target for a specific period. It is an important KPI for sales managers as it helps them to understand the sales team’s progress towards meeting their revenue targets. A higher sales pipeline coverage indicates that the sales team is on track to meet their revenue targets.
Example
This KPI measures the ratio of the value of the sales pipeline to the sales quota. It helps assess the company’s sales performance and forecast future revenue.
Example: A company’s sales pipeline coverage is 150%, meaning that the value of the sales pipeline is 150% of the sales quota.
18. Lead Velocity Rate
Lead Velocity Rate is the rate at which new leads are added to the sales pipeline. It is an important KPI for sales managers as it reflects the effectiveness of their lead generation efforts. A higher lead velocity rate indicates that the sales team is consistently adding new leads to the pipeline, which can help in meeting the revenue targets.
Example
This KPI measures the rate of increase or decrease in the number of leads. It helps assess the effectiveness of the lead generation efforts.
Example: A company’s lead velocity rate is 10%, meaning that the number of leads is increasing at a rate of 10%.
19. Sales Activity Ratio
Sales Activity Ratio is the ratio of the number of sales activities (calls, emails, meetings) to the number of deals closed. It is an important KPI for sales managers as it reflects the level of activity required to close a deal. A higher sales activity ratio indicates that the sales team is putting in the necessary effort to close deals and generate revenue for the company.
Example
Sales Activity Ratio is a sales activity-based metric that measures the ratio of the number of sales activities (calls, emails, meetings) to the number of deals closed. It provides insight into the level of activity required to close a deal, indicating how efficient and effective the sales team is in generating revenue for the company.
Example, if a sales representative made 100 sales calls in a month and closed 10 deals, the sales activity ratio would be 10:1. This means that for every 10 sales activities, one deal is closed. A high sales activity ratio may indicate that the sales team is making enough effort to generate leads and close deals, while a low ratio may indicate that the team needs to improve their sales activities or lead generation tactics to increase their chances of closing deals.
Customer-based Sales KPI
Customer-based metrics focus on the customer experience and help sales managers measure how well their team is meeting customer needs and expectations. Here are some key customer-based metrics that sales managers should pay attention to:
20. Customer Satisfaction Score (CSS)
CSS is a measure of how satisfied customers are with a product or service. This can be measured through surveys, feedback forms, or customer reviews. A high CSS indicates that customers are happy with the product or service and are likely to become repeat customers.
Example
This metric measures the level of satisfaction a customer has with a product or service. It is usually measured by conducting surveys and asking customers to rate their satisfaction level on a scale of 1-10.
Example: A hotel chain conducts a survey asking customers to rate their satisfaction with their recent stay on a scale of 1-10. The average score is then calculated to determine the Customer Satisfaction Score.
21. Net Promoter Score (NPS)
NPS is a metric that measures how likely customers are to recommend a product or service to others. It is based on a 0-10 scale, with scores of 9-10 considered “promoters,” 7-8 considered “passives,” and 0-6 considered “detractors.” NPS is calculated by subtracting the percentage of detractors from the percentage of promoters. A high NPS indicates that customers are happy with the product or service and are likely to recommend it to others.
Example
This metric measures the likelihood of a customer to recommend a product or service to others. Customers are asked to rate their likelihood of recommending on a scale of 0-10, and are then grouped into three categories: promoters (9-10), passives (7-8), and detractors (0-6). The Net Promoter Score is then calculated by subtracting the percentage of detractors from the percentage of promoters.
Example: A software company sends out a survey asking customers to rate their likelihood of recommending their product on a scale of 0-10. The responses are then categorized and the Net Promoter Score is calculated.
22. Customer Churn Rate
Churn rate is the percentage of customers who stop using a product or service over a given period. A high churn rate indicates that customers are not satisfied with the product or service and are leaving. It is important for sales managers to identify the reasons why customers are leaving and take steps to improve the product or service.
Example
This metric measures the percentage of customers lost over a given period. It is calculated by dividing the number of customers lost by the total number of customers at the beginning of the period.
Example: A mobile phone company loses 1000 customers in a month, and had 10,000 customers at the beginning of the month. The Customer Churn Rate for that month would be 10%.
23. Customer Retention Rate
Retention rate is the percentage of customers who continue to use a product or service over a given period. A high retention rate indicates that customers are happy with the product or service and are likely to become repeat customers. Sales managers can use retention rate to track the success of their customer retention efforts.
Example
This metric measures the percentage of customers retained over a given period. It is calculated by subtracting the number of customers lost from the total number of customers at the beginning of the period, and then dividing by the total number of customers at the beginning of the period.
Example: A subscription-based service had 100,000 customers at the beginning of the year. Over the course of the year, they lost 10,000 customers. The Customer Retention Rate for the year would be 90%.
24. Upsell/Cross-sell Ratio
Upselling and cross-selling are important strategies for increasing revenue from existing customers. Upselling involves selling a higher-priced version of a product or service to an existing customer, while cross-selling involves selling a related product or service to an existing customer. The upsell/cross-sell ratio measures the percentage of customers who buy additional products or services. A high ratio indicates that customers are receptive to upselling and cross-selling.
Example
This metric measures the ratio of revenue generated from upselling/cross-selling to total revenue. It is calculated by dividing the revenue generated from upselling/cross-selling by the total revenue.
Example: A car dealership generated $1 million in revenue in a month. Of that, $200,000 was from upselling/cross-selling additional features to customers. The Upsell/Cross-sell Ratio for that month would be 20%.
25. Average Time to Renewal
Average time to renewal is the average amount of time it takes for a customer to renew their subscription or contract. This metric can help sales managers identify customers who are at risk of not renewing and take steps to retain them.
Example
This metric measures the average time taken for a customer to renew a contract. It is calculated by adding up the time taken for each customer to renew and dividing by the total number of customers.
Example: A software company has 1000 customers with annual contracts. The company calculates the time taken for each customer to renew, and finds that the average time to renewal is 30 days.
26. Average Time to First Sale
Average time to first sale measures the amount of time it takes for a new customer to make their first purchase. This metric can help sales managers identify areas where the sales process can be improved to shorten the time to first sale.
Example
This metric measures the average time taken for a lead to make their first purchase. It is calculated by adding up the time taken for each lead to make their first purchase and dividing by the total number of leads.
Example: An online retailer tracks the time taken for each lead to make their first purchase. They find that the average time to first sale is 10 days.
27. Referral Rate
Referral rate measures the percentage of customers who refer new customers to the company. A high referral rate indicates that customers are satisfied with the product or service and are willing to recommend it to others.
Example
This metric measures the percentage of new customers gained from referrals. It is calculated by dividing the number of new customers gained from referrals by the total number of new customers.
Example: A restaurant offers a referral program where customers receive a discount on their next visit for referring a friend. The restaurant tracks the number of new customers who were referred by existing customers.
28. Customer Complaints
Customer complaints are a valuable source of feedback for sales managers. Tracking the number and types of complaints can help identify areas where the product or service can be improved, and help sales managers address customer concerns in a timely manner.
Example
Customer Complaints is a customer-based metric that measures the number of complaints received from customers within a given period. This metric is important as it can help a company identify areas for improvement in their products, services, or customer service processes.
For example, if a company receives a high number of complaints related to a particular product, it may indicate that there is a problem with the product that needs to be addressed. Alternatively, if customers are complaining about the customer service experience, the company may need to review their customer service processes and make improvements.
Related article : Practical KPI Examples
Templates and Dashboards for Sales KPIs
")
Sales KPI Spreadsheet Templates
One of the most common ways to track and visualize sales KPIs is through spreadsheet templates. These templates can be customized to suit your specific needs and can provide a centralized location for all your sales data. Here are a few examples of sales spreadsheet templates:
1. Sales Dashboard Template
A sales dashboard template is a one-stop-shop for monitoring your sales KPIs. It typically includes visual representations of your revenue-based, activity-based, and customer-based metrics. The dashboard can be customized to suit your needs, and you can easily update it with new data as it becomes available.
2. Sales Forecasting Template
A sales forecasting template allows you to predict future sales based on historical data. This can be a useful tool for sales managers who need to plan ahead and make strategic decisions. The template typically includes historical sales data, as well as a variety of forecasting models that can be used to predict future sales.
3. Sales Pipeline Management Template
A sales pipeline management template allows you to track your sales leads as they move through your sales funnel. It typically includes stages such as prospecting, qualification, proposal, and closing, and allows you to track the number of leads in each stage. This can be a useful tool for identifying bottlenecks in your sales process and optimizing your pipeline.
4. Sales Funnel Template
A sales funnel template is similar to a sales pipeline management template, but it focuses on the conversion rates between each stage of the funnel. This can be a useful tool for identifying areas of your sales process where you may be losing potential customers.
5. Sales Performance Tracking Template
A sales performance tracking template allows you to track the performance of individual sales reps or teams. It typically includes metrics such as total revenue generated, number of leads generated, and conversion rates. This can be a useful tool for identifying top-performing sales reps and areas where additional training may be needed.

Sales KPI Dashboard Tools
In addition to using spreadsheet templates, sales managers can also use various dashboard tools to track and visualize their sales KPIs. Here are five popular dashboard tools for sales KPI tracking:
1. Hubspot CRM Dashboard
Hubspot CRM is a customer relationship management tool that includes a built-in dashboard for tracking sales KPIs. With the dashboard, sales managers can track metrics such as revenue, deals won and lost, and sales activities. The dashboard also provides visualizations of the data, making it easy to identify trends and make informed decisions..
2. Salesforce Dashboard
Salesforce is another popular CRM tool that includes a dashboard for tracking sales KPIs. The Salesforce dashboard allows sales managers to track metrics such as pipeline velocity, lead conversion rate, and win/loss ratio. The dashboard is highly customizable, allowing users to choose which metrics to track and how to visualize the data.
3. Microsoft Power BI Dashboard
Microsoft Power BI is a data visualization tool that can be used to create customized sales dashboards. With Power BI, sales managers can track metrics such as revenue, sales cycle length, and sales by product or region. The tool also allows users to create interactive visualizations and drill-down reports for deeper analysis.
4. Tableau Dashboard
Tableau is another data visualization tool that can be used to create sales dashboards. With Tableau, sales managers can track metrics such as revenue, customer acquisition cost, and customer lifetime value. The tool also allows users to create interactive dashboards and reports that can be shared with team members
5. Google Analytics Dashboard
Google Analytics is a web analytics tool that can be used to track website traffic and sales conversions. With the tool, sales managers can track metrics such as website traffic, bounce rate, and conversion rate. The tool also includes a dashboard that provides visualizations of the data, making it easy to identify trends and opportunities for improvement.
Importance Of Sales KPI Templates and Dashboards
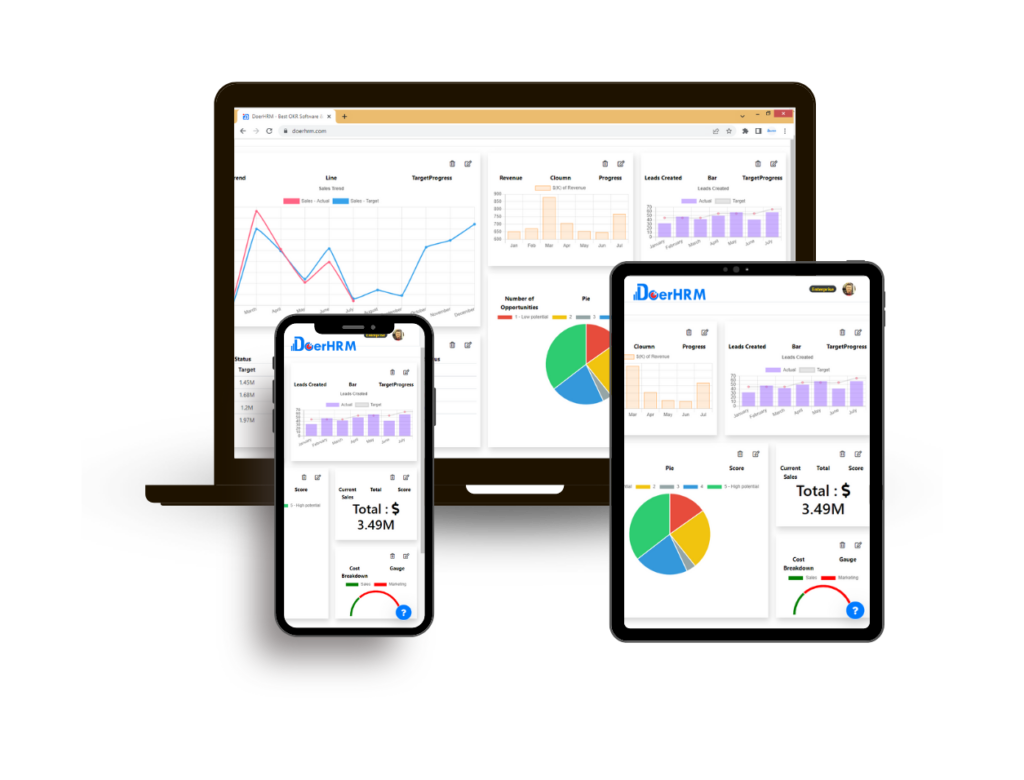
DoerHRM Software is a comprehensive HR management solution that includes features for managing sales performance and tracking sales KPIs. Here are some ways in which the software can help businesses to improve their sales performance:
Customizable KPI templates: DoerHRM software allows businesses to create customized KPI templates for sales performance, enabling them to track specific metrics that are relevant to their business objectives. This helps businesses to measure their performance against their goals and make data-driven decisions.
Real-time data: DoerHRM software provides real-time data on sales performance, allowing businesses to track their progress and make adjustments as necessary. This ensures that businesses are always aware of their performance and can take action to improve their results.
Easy visualization: DoerHRM software provides easy-to-use dashboards for visualizing sales KPI data, making it easier for sales teams to understand their performance and take action to improve it. This helps to increase transparency and accountability within the sales team.
Employee performance tracking: DoerHRM software enables businesses to track individual sales team member performance, allowing them to identify high-performing employees and provide coaching and support to those who need it. This helps to improve overall sales team performance.
Goal setting and tracking: DoerHRM software allows businesses to set sales goals and track progress towards those goals. This helps to ensure that the sales team is aligned with the business objectives and is working towards achieving them.
Overall, DoerHRM software is an important tool for businesses that want to improve their sales performance. By providing customizable KPI templates, real-time data, easy visualization, employee performance tracking, and goal setting and tracking features, the software helps businesses to make data-driven decisions and improve their sales performance.
Conclusion
In conclusion, tracking sales KPIs is crucial for any sales manager looking to improve their team’s performance and drive revenue growth. These metrics provide valuable insights into the effectiveness of your sales efforts and enable you to make data-driven decisions that can improve your overall sales strategy.
The key metrics that sales managers should track can be grouped into three categories: revenue-based metrics, activity-based metrics, and customer-based metrics. Revenue-based metrics like sales revenue, sales growth rate, and customer lifetime value provide an overview of the financial performance of your sales team. Activity-based metrics like sales calls, lead response time, and sales cycle length measure the productivity and efficiency of your sales team. Customer-based metrics like customer satisfaction score, customer churn rate, and referral rate give you an understanding of your customers’ experience with your brand.
There are various templates and dashboards available to help sales managers track and analyze their sales KPIs effectively. Spreadsheet templates like the sales dashboard template, sales pipeline management template, and sales performance tracking template can be easily customized to fit your specific needs. Additionally, dashboard tools like Hubspot CRM Dashboard, Salesforce Dashboard, Microsoft Power BI Dashboard, Tableau Dashboard, and Google Analytics Dashboard offer more advanced features for data visualization and analysis.
By utilizing these templates and dashboard tools, sales managers can save time and effort while gaining deeper insights into their sales performance. Ultimately, the success of your sales team relies on your ability to track and analyze your sales KPIs effectively and make data-driven decisions that drive revenue growth.