
The Human Resource (HR) department is responsible for managing a company’s most important asset: its employees. The success of an organization depends heavily on the performance of its workforce, and the HR department plays a critical role in ensuring that employees are motivated, engaged, and productive. One of the ways that HR managers can track the performance of their department is by measuring Key Performance Indicators (KPIs). HR KPI (Human Resource Key Performance Indicator) are specific metrics that are used to measure the effectiveness of an organization’s HR practices.
KPIs are a set of measurable metrics that allow HR managers to monitor their department’s performance and make data-driven decisions. By tracking KPIs, HR managers can identify areas of improvement, evaluate the effectiveness of their HR strategies, and make informed decisions to optimize their HR processes.
In this article, we will discuss the top 20 HR KPI metrics and examples for Human Resource Manager, Executive, and Department. We will also explore the importance of measuring HR performance, and how HR Management Systems (HRMS) can help HR departments to measure KPIs accurately and efficiently. By the end of this article, you will have a clear understanding of the most critical HR KPIs, and how to use them to improve your HR department’s performance.
What is HR KPI metrics?
HR KPI metrics are a set of measurable indicators that allow Human Resource managers to track and evaluate the performance of their HR department. These metrics are used to identify areas of improvement, measure the effectiveness of HR strategies, and make data-driven decisions to optimize HR processes.
HR KPI metrics can be used to measure a wide range of factors, including employee engagement, productivity, recruitment, retention, and more. By tracking these metrics, HR managers can gain valuable insights into their department’s performance and make informed decisions to improve the organization’s overall effectiveness.
Some of the most common HR KPI metrics include employee turnover rate, time to hire, cost per hire, absenteeism rate, training and development metrics, employee engagement, time to productivity, diversity and inclusion metrics, employee satisfaction, employee retention, and many more.
Each HR KPI metric serves a specific purpose and provides a unique perspective on the HR department’s performance. For example, the employee turnover rate metric can help HR managers evaluate the effectiveness of their recruitment and retention strategies, while the employee engagement metric can help them identify areas where employees may be disengaged and take corrective action.
Overall, HR KPI metrics are essential tools for HR managers to evaluate their department’s performance, identify areas for improvement, and make data-driven decisions to optimize their HR processes.
Related article : What is a Key Performance Indicator (KPI)? Meaning, Templates, Examples
What is the importance of measuring HR performance?
Measuring HR performance through the use of KPI metrics is critical for organizations to ensure that their HR department is aligned with their overall business strategy. The HR department is responsible for managing the most important asset of any company, its employees, and measuring its performance helps to ensure that the employees are being managed in the most effective way possible.
By measuring HR KPI metrics, organizations can gain insight into their HR department’s strengths and weaknesses, and identify areas where improvements can be made. This can help them optimize their HR processes, improve employee engagement and retention, and ultimately contribute to the organization’s success.
Measuring HR performance is also important for identifying trends over time. By tracking KPI metrics on a regular basis, HR managers can identify patterns and trends that can provide insights into the effectiveness of their strategies. For example, if a company is experiencing a high turnover rate, HR managers can analyze the data to identify why this is happening and take steps to address the issue.
In addition, measuring HR performance can help HR managers to justify their decisions and strategies to senior management. By having objective data to back up their claims, they can demonstrate the impact of their HR strategies on the organization’s success.
Overall, measuring HR performance through the use of KPI metrics is critical for organizations to ensure that their HR department is contributing to the overall success of the company. It allows HR managers to make data-driven decisions, optimize their HR processes, and ultimately create a more engaged and productive workforce.
Related article : Top 11 Important Training KPIs HR Managers Should Have
Role of HRMS in measuring HR KPIs
Human Resource Management Systems (HRMS) play a critical role in measuring HR KPIs. These systems are designed to automate and streamline HR processes, including the collection and analysis of HR data. By using an HRMS, HR managers can easily access and analyze data related to their HR KPIs, allowing them to make informed decisions to optimize their HR processes.
One of the main benefits of using an HRMS to measure HR KPIs is that it enables HR managers to collect and analyze data in real-time. With real-time data, they can identify issues as they arise and take corrective action quickly. This can help organizations to improve their HR processes and increase their overall efficiency.
HRMS also make it easier for HR managers to track and report on KPI metrics. Instead of manually collecting and analyzing data from multiple sources, an HRMS can automate this process, reducing the risk of errors and saving HR managers time. With an HRMS, HR managers can create customized reports that provide insights into their department’s performance, and share these reports with senior management and other stakeholders.
In addition, HRMS can provide valuable insights into workforce trends and patterns. By analyzing data over time, HR managers can identify areas where performance is improving or declining and take steps to address the issue. For example, an HRMS can help HR managers identify areas where employee training and development is needed, or where retention strategies need to be improved.
Overall, HRMS are an essential tool for measuring HR KPIs. They enable HR managers to collect and analyze data in real time, track and report on KPI metrics, and gain valuable insights into workforce trends and patterns. By using an HRMS to measure HR KPIs, organizations can optimize their HR processes and contribute to their overall success.
Related article : Sales KPI: 28 Metrics for Sales Manager – Examples, Meaning, Template, Dashboard
HR KPI 1 : Employee Turnover Rate
The employee turnover rate is a KPI metric used to measure the number or percentage of employees who leave an organization over a specific period of time. Employee turnover can be voluntary (resignations) or involuntary (termination or dismissal). Measuring employee turnover rate is important for organizations because it helps them understand the effectiveness of their recruitment, retention, and talent management strategies.
High employee turnover can be a costly problem for organizations. The cost of replacing an employee can be high due to recruitment, training, and onboarding expenses. Additionally, high turnover can negatively impact employee morale, productivity, and customer satisfaction.
Calculation formula:
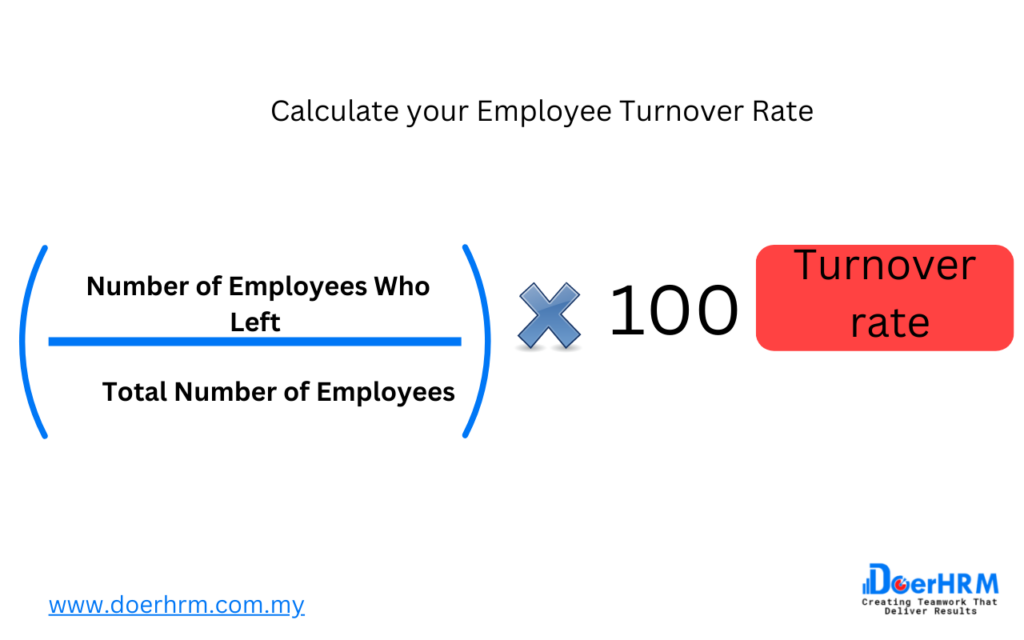
To calculate the employee turnover rate, organizations need to divide the number of employees who left the organization by the total number of employees and multiply the result by 100. The formula can be expressed as:
Employee Turnover Rate = (Number of Employees Who Left / Total Number of Employees) x 100
Example:
Suppose an organization had 100 employees at the beginning of the year, and during the year, 10 employees left the organization voluntarily or involuntarily. To calculate the employee turnover rate for the year, we would use the following formula:
Employee Turnover Rate = (10 / 100) x 100 = 10%
This means that the organization had a turnover rate of 10% for the year. This can be used as a benchmark to track the organization’s progress in reducing turnover and improving retention strategies over time.
Overall, measuring employee turnover rate is important for organizations to evaluate the effectiveness of their recruitment and retention strategies. By calculating this KPI metric, organizations can identify trends and patterns that can help them improve their employee retention strategies, reduce the cost of turnover, and ultimately contribute to the organization’s success.
HR KPI 2: Time to Hire
Time to hire is a KPI metric used to measure the amount of time it takes an organization to fill a job opening from the time it was posted to the time a candidate accepts an offer. Measuring time to hire is important for organizations because it helps them evaluate the efficiency of their recruitment process, identify bottlenecks, and make improvements to the process.
A long time to hire can negatively impact an organization’s ability to attract and retain top talent. Delayed hiring can result in lost productivity, decreased employee morale, and increased costs associated with job vacancy. Measuring time to hire allows organizations to track their progress in reducing the time it takes to fill open positions, improving the candidate experience, and ultimately contributing to the organization’s success.
Calculation formula:
To calculate time to hire, organizations need to subtract the date the job opening was posted from the date the candidate accepted the offer. The formula can be expressed as:
Time to Hire = Date Candidate Accepted Offer – Date Job Opening was Posted
Example:
Suppose an organization posted a job opening on January 1 and a candidate accepted the offer on February 15. To calculate the time to hire, we would subtract the date the job opening was posted from the date the candidate accepted the offer.
Time to Hire = February 15 – January 1 = 45 days
This means that it took the organization 45 days to fill the job opening. The organization can use this metric to evaluate their recruitment process and identify areas for improvement, such as streamlining the screening process or reducing the time it takes to schedule interviews.
Overall, measuring time to hire is important for organizations to evaluate the efficiency of their recruitment process and make improvements to attract and retain top talent. By calculating this KPI metric, organizations can identify bottlenecks in their recruitment process, reduce the time it takes to fill open positions, improve the candidate experience, and ultimately contribute to the organization’s success.
Related article : Why KPIs Are Important: 10 Reason Key Performance Indicators Stands For? -Meaning, Examples ,Template
HR KPI 3: Cost per Hire
Cost per hire is a KPI metric used to measure the total cost incurred by an organization to fill a job opening. Measuring cost per hire is important for organizations because it helps them evaluate the effectiveness of their recruitment strategies and determine the budget required to attract and retain top talent.
Calculating cost per hire allows organizations to identify areas where they can reduce recruitment costs, such as optimizing job postings, improving the candidate experience, and streamlining the recruitment process. By measuring this KPI metric, organizations can make informed decisions to reduce recruitment costs while attracting and retaining top talent.
Calculation formula:
To calculate the cost per hire, organizations need to add up all the costs associated with filling a job opening and divide it by the total number of hires. The formula can be expressed as:
Cost per Hire = Total Recruitment Costs / Total Number of Hires
Recruitment costs can include expenses such as advertising, job postings, recruiter fees, travel expenses, background checks, and onboarding costs.
Example:
Suppose an organization incurs the following recruitment expenses in a year:
- Advertising costs: $10,000
- Job postings: $5,000
- Recruiter fees: $20,000
- Travel expenses: $2,000
- Background checks: $3,000
- Onboarding costs: $8,000
The total recruitment costs would be $48,000. If the organization made 20 hires during the year, the cost per hire would be calculated as:
Cost per Hire = $48,000 / 20 = $2,400
This means that it cost the organization $2,400 on average to fill each job opening. The organization can use this metric to evaluate their recruitment process and identify areas where they can reduce costs while attracting and retaining top talent.
Overall, measuring cost per hire is important for organizations to evaluate the effectiveness of their recruitment strategies and determine the budget required to attract and retain top talent. By calculating this KPI metric, organizations can identify areas where they can reduce recruitment costs, make informed decisions to attract and retain top talent, and ultimately contribute to the organization’s success.
Related article : Marketing KPI: 25 Digital Marketing Key Performance Indicators for Sales & Marketing- Manager, Department, Examples
HR KPI 4: Absenteeism Rate
Absenteeism rate is a KPI metric used to measure the number of days an employee is absent from work as a percentage of their total working days. Measuring absenteeism rate is important for organizations because it helps them evaluate the impact of absenteeism on productivity, identify trends, and develop strategies to reduce absenteeism.
High absenteeism rates can negatively impact an organization’s productivity, morale, and profitability. Measuring absenteeism rate allows organizations to track their progress in reducing absenteeism, improve employee attendance, and ultimately contribute to the organization’s success.
Calculation formula:
To calculate absenteeism rate, organizations need to divide the total number of days absent by the total number of scheduled working days. The formula can be expressed as:
Absenteeism Rate = (Total Number of Days Absent / Total Number of Scheduled Working Days) x 100%
Example:
Suppose an organization has 100 employees who are scheduled to work 260 days in a year. The total number of days absent for all employees in the year is 500. To calculate the absenteeism rate, we would use the formula:
Absenteeism Rate = (500 / (100 x 260)) x 100% = 1.92%
This means that on average, each employee was absent for 1.92% of their scheduled working days. The organization can use this metric to evaluate the impact of absenteeism on productivity, identify trends, and develop strategies to reduce absenteeism, such as implementing flexible work arrangements, improving employee engagement, and providing incentives for attendance.
Overall, measuring absenteeism rate is important for organizations to evaluate the impact of absenteeism on productivity, identify trends, and develop strategies to reduce absenteeism. By calculating this KPI metric, organizations can track their progress in reducing absenteeism, improve employee attendance, and ultimately contribute to the organization’s success.
Related article : IT KPI : 25 Key Performance Indicator for IT Managers – Meaning ,Dashboard and Examples
HR KPI 5: Training and Development
Training and development is a KPI metric used to measure the effectiveness of an organization’s training and development programs. Measuring this metric is important for organizations because it helps them evaluate the impact of their investment in employee training and development on employee performance, retention, and overall business success.
Effective training and development programs can improve employee skills, knowledge, and competencies, which can lead to increased productivity, innovation, and profitability. Measuring training and development KPIs allows organizations to identify gaps in their training programs, evaluate the effectiveness of their training initiatives, and develop strategies to improve the quality of their training and development programs.
Calculation Formula:
The formula for calculating training and development KPI metrics can vary depending on the specific goals and objectives of the organization’s training and development programs. Some common formulas used to measure this metric include:
- Training Cost per Employee: This metric measures the total cost of training and development activities per employee. The formula for calculating this metric can be expressed as:
Training Cost per Employee = (Total Training Costs / Total Number of Employees)
- Training Return on Investment (ROI): This metric measures the return on investment for training and development activities. The formula for calculating this metric can be expressed as:
Training ROI = ((Total Benefits – Total Costs) / Total Costs) x 100%
Example:
Suppose an organization spent $100,000 on training and development programs in a year and has 50 employees. To calculate the training cost per employee, we would use the formula:
Training Cost per Employee = (100,000 / 50) = $2,000
This means that the organization spent an average of $2,000 per employee on training and development activities.
To calculate the training ROI, we would need to determine the total benefits of the training program. For example, the organization might measure the increase in employee productivity, the reduction in employee turnover, or the improvement in customer satisfaction resulting from the training program. Suppose the total benefits of the training program are $150,000. Using the formula:
Training ROI = ((150,000 – 100,000) / 100,000) x 100% = 50%
This means that for every dollar spent on training and development programs, the organization received a return of 50 cents in benefits.
Overall, measuring training and development KPI metrics is important for organizations to evaluate the impact of their investment in employee training and development on employee performance, retention, and overall business success. By calculating this metric, organizations can identify gaps in their training programs, evaluate the effectiveness of their training initiatives, and develop strategies to improve the quality of their training and development programs.
Related article : SMART KPI : What Is Smart KPIs and How to Use It In Business – Meaning , Examples, Dashboard and Template
HR KPI 6: Employee Engagement
Employee engagement is a KPI metric used to measure the level of employee commitment and emotional connection to their job and the organization they work for. Measuring employee engagement is important for organizations because it has a direct impact on employee retention, job satisfaction, productivity, and overall business success.
High levels of employee engagement can lead to increased employee motivation, better customer service, higher sales, and a more positive workplace culture. On the other hand, low levels of employee engagement can lead to higher turnover rates, decreased productivity, and negative impacts on the overall business bottom line. Measuring employee engagement KPIs allows organizations to identify areas of improvement and develop strategies to increase employee engagement levels.
Calculation Formula:
The formula for calculating employee engagement KPI metrics can vary depending on the specific goals and objectives of the organization’s engagement initiatives. Some common formulas used to measure this metric include:
- Employee Net Promoter Score (eNPS): This metric measures the likelihood of employees to recommend their organization as a good place to work. The formula for calculating eNPS can be expressed as:
eNPS = (% of Promoters – % of Detractors) x 100%
Promoters are employees who score 9 or 10 on a 10-point scale when asked if they would recommend their organization as a good place to work. Detractors are employees who score 6 or below on the same scale.
- Employee Engagement Survey: This metric measures employee perceptions of their workplace and their level of engagement with their job and the organization. The survey can include questions related to job satisfaction, leadership, communication, recognition, and other factors that impact employee engagement.
Example:
Suppose an organization conducts an employee engagement survey and receives responses from 200 employees. The survey includes questions related to job satisfaction, communication, and recognition. Based on the survey results, the organization finds that:
- 70% of employees are satisfied with their job
- 60% of employees feel they receive adequate recognition for their work
- 50% of employees feel they receive clear communication from their leadership
To calculate the overall employee engagement score, the organization might assign weights to each survey question based on their importance and calculate an average score. For example, if the organization assigns a weight of 40% to job satisfaction, 30% to recognition, and 30% to communication, the overall engagement score would be:
Overall Engagement Score = (70% x 40%) + (60% x 30%) + (50% x 30%) = 63%
This means that the overall employee engagement level in the organization is 63%. Based on this result, the organization might identify areas for improvement and develop strategies to increase employee engagement levels, such as implementing an employee recognition program or improving communication channels between leadership and employees.
Overall, measuring employee engagement KPI metrics is important for organizations to evaluate the level of employee commitment and emotional connection to their job and the organization they work for. By calculating this metric, organizations can identify areas of improvement and develop strategies to increase employee engagement levels, leading to increased employee retention, job satisfaction, productivity, and overall business success.
Related article : KPI Scorecards : Track Your Business Performance – Meaning , Template ,Dashboards , Examples
HR KPI 7: Time to Productivity
Definition and Importance:
Time to productivity is a KPI metric that measures the time it takes for a new hire to become fully productive and contribute to the organization’s goals and objectives. It is an important metric for organizations to understand how quickly new employees are able to start generating value and contributing to the overall productivity of the organization. A shorter time to productivity indicates an efficient onboarding process and effective training, which can lead to improved employee retention, engagement, and overall organizational performance.
Calculation Formula:
The formula for calculating time to productivity can vary depending on the specific roles and responsibilities of new hires, as well as the goals and objectives of the organization. However, a common formula for calculating time to productivity is:
Time to Productivity = (Total Time to Full Productivity – Time Spent on Onboarding and Training) / Total Time to Full Productivity
Total Time to Full Productivity refers to the estimated time it takes for a new hire to become fully productive and proficient in their role. This can vary depending on the nature of the job and the complexity of the tasks involved.
Time Spent on Onboarding and Training refers to the amount of time spent on the onboarding and training process for the new hire, including orientation, job-specific training, and other relevant activities.
Example:
Let’s take an example of an organization that estimates the total time to full productivity for a new hire in a certain role to be 3 months. The organization invests 1 month in the onboarding and training process for the new hire. Using the formula mentioned above, we can calculate the time to productivity as follows:
Time to Productivity = (3 months – 1 month) / 3 months = 2/3 or approximately 0.67
This means that the new hire takes approximately 0.67 (or 67%) of the total time to reach full productivity after subtracting the time spent on onboarding and training. The organization can use this metric to assess the effectiveness of their onboarding and training processes and make improvements to accelerate the time to productivity for new hires.
Measuring time to productivity is important for organizations to ensure that new hires are able to start generating value and contributing to the organization’s goals and objectives as quickly as possible. By calculating this metric, organizations can identify areas of improvement in their onboarding and training processes, leading to more efficient and effective onboarding, higher employee retention, and improved overall organizational performance.
Related article : Social Media KPIs for Managers : 25 Metrics You Should Be Tracking for Your Marketing Strategy
HR KPI 8: Diversity and Inclusion
Definition and Importance:
Diversity and inclusion are important aspects of HR management that focus on creating a workforce that is representative of different backgrounds, cultures, and perspectives, and fostering an inclusive environment where all employees feel valued, respected, and included. Diversity refers to the presence of differences among employees, such as age, gender, race, ethnicity, sexual orientation, disability, and more, while inclusion refers to creating an environment where all employees feel welcomed, respected, and valued for their unique contributions.
Measuring diversity and inclusion is crucial for organizations as it promotes fairness, equality, and diversity of thought, which can lead to better decision-making, innovation, creativity, and overall organizational performance. A diverse and inclusive workforce can also enhance employee engagement, retention, and productivity, and help organizations attract and retain top talent from diverse backgrounds.
Calculation Formula:
Measuring diversity and inclusion can be challenging as it involves capturing qualitative data related to employee experiences and perceptions. However, some quantitative metrics that can be used to measure diversity and inclusion in the workplace include:
- Diversity Index: The diversity index is calculated by dividing the number of employees from diverse backgrounds (e.g., gender, ethnicity, age, etc.) by the total number of employees in the organization, and multiplying by 100 to get a percentage.
Diversity Index = (Number of Employees from Diverse Backgrounds / Total Number of Employees) x 100
- Inclusion Index: The inclusion index is calculated based on employee feedback on their perceptions of inclusion in the workplace, which can be captured through surveys, focus groups, or other qualitative methods. Employees can rate their experiences of inclusion on a scale, and the inclusion index can be calculated as the average rating.
Inclusion Index = Average Rating of Inclusion Experiences
Example:
Let’s take an example of an organization with 500 employees, out of which 100 employees are from diverse backgrounds (e.g., gender, ethnicity, age, etc.). Using the diversity index formula, we can calculate the diversity index as follows:
Diversity Index = (100 / 500) x 100 = 20%
This means that 20% of the organization’s workforce is from diverse backgrounds.
For the inclusion index, the organization conducts a survey among its employees and collects feedback on their experiences of inclusion in the workplace. The average rating of inclusion experiences is calculated to be 4.2 on a scale of 1 to 5. Therefore, the inclusion index for the organization would be 4.2.
Measuring diversity and inclusion through these metrics can provide organizations with insights into the representation of diverse employees in their workforce and the level of inclusivity experienced by employees. This can help organizations identify areas of improvement, develop strategies and initiatives to foster a more diverse and inclusive workplace, and enhance overall organizational performance. It also sends a positive message to employees, customers, and other stakeholders that the organization values diversity and is committed to creating an inclusive work environment.
Relate article: KPI for Finance Department: 26 Essential Metrics to Monitor for Finance Manager with Examples
HR KPI 9: Employee Satisfaction
Definition and Importance:
Employee satisfaction is a measure of the extent to which employees are content and fulfilled with their job, work environment, and overall experience in the organization. It is an important HR KPI metric as it reflects the level of engagement, motivation, and happiness of employees, which can directly impact their performance, productivity, and retention.
Measuring employee satisfaction is crucial for organizations as it helps them understand the overall well-being and happiness of their workforce. Satisfied employees are more likely to be engaged, loyal, and committed to their job and organization, resulting in higher levels of productivity, innovation, and customer satisfaction. On the other hand, dissatisfied employees may become disengaged, unproductive, and may even leave the organization, leading to increased turnover and associated costs.
Calculation Formula:
Measuring employee satisfaction can be done through surveys, questionnaires, or other qualitative methods that capture employees’ perceptions, opinions, and feedback. The calculation of employee satisfaction can be based on the responses provided by employees, which are typically rated on a scale.
One common approach is to use a Likert scale, where employees rate their level of satisfaction with their job, work environment, and other relevant factors on a scale of 1 to 5, with 1 being “very dissatisfied” and 5 being “very satisfied”. The average rating of all responses can then be used as the employee satisfaction score.
Employee Satisfaction Score = Average Rating of Employee Satisfaction Responses
Example:
Let’s take an example of an organization that conducts an annual employee satisfaction survey among its workforce of 500 employees. The survey includes questions related to job satisfaction, work environment, communication, leadership, and other relevant factors, which employees rate on a scale of 1 to 5.
After collecting and analyzing the survey responses, the organization calculates the average rating of employee satisfaction as 4.2. This means that, on average, employees in the organization are moderately satisfied with their job and work environment.
Measuring employee satisfaction through this metric allows the organization to gain insights into the overall happiness and engagement of employees, identify areas of improvement, and take necessary actions to enhance employee satisfaction levels. It also helps organizations benchmark their performance against industry standards or previous years’ results and track changes in employee satisfaction over time.
In conclusion, measuring employee satisfaction is essential for HR managers and executives to understand the well-being and happiness of their workforce and take proactive measures to improve overall employee engagement, productivity, and retention. A satisfied and engaged workforce can contribute significantly to the success and growth of an organization.
Related article : Customer Service KPI: 20 Metrics To Measure Team Performance – Meaning, Examples, Templates, and Dashboard
HR KPI 10: Employee Retention
Definition and Importance:
Employee retention is a measure of the ability of an organization to retain its employees over a specified period of time. It is an important HR KPI metric as it reflects the effectiveness of an organization’s efforts in retaining its valuable talent, reducing turnover, and maintaining a stable workforce.
Employee retention is crucial for organizations as high employee turnover can result in increased recruitment and training costs, loss of productivity, disruption of team dynamics, and negative impact on organizational culture. Retaining top-performing employees is essential for maintaining a high-performing workforce, ensuring continuity of business operations, and achieving long-term organizational success.
Calculation Formula:
The calculation of employee retention rate can be done using the following formula:
Employee Retention Rate = ((Number of Employees at the End of a Period – Number of Employees Who Left During the Period) / Number of Employees at the Beginning of the Period) x 100
This formula calculates the percentage of employees who remained with the organization during a specific period, usually expressed as a percentage.
Example:
Let’s take an example of an organization that had 500 employees at the beginning of the year and hired 50 new employees during the year. However, 20 employees left the organization during the same period. So, at the end of the year, the organization had 530 employees.
Using the above formula, we can calculate the employee retention rate as follows:
Employee Retention Rate = ((530 – 20) / 500) x 100 = 102%
This means that the organization was able to retain 102% of its employees during the year, which indicates a positive retention rate as it signifies that more employees stayed with the organization compared to those who left.
Measuring employee retention rate helps organizations identify trends, patterns, and reasons for employee turnover, and take appropriate actions to improve employee retention. It also allows organizations to benchmark their performance against industry standards or previous years’ results and track changes in retention rate over time.
In conclusion, measuring employee retention is critical for HR managers and executives to assess the effectiveness of their efforts in retaining valuable talent and maintaining a stable workforce. A high employee retention rate can lead to improved productivity, engagement, and organizational success, while reducing turnover costs and disruptions.
Related article : KPI In Project Management : KPIs In Agile For Planning Project Management – A Consultant’s Guide With Examples
HR KPI 11: Cost of Training per Employee
Definition and Importance:
The cost of training per employee is a key HR KPI metric that measures the average cost incurred by an organization to provide training and development opportunities to its employees. It includes the costs associated with designing, delivering, and administering various training programs, such as workshops, seminars, e-learning, certifications, and other forms of employee development initiatives.
The cost of training per employee is an important metric as it helps organizations assess the efficiency and effectiveness of their training programs, and the return on investment (ROI) for their training initiatives. It allows HR managers and executives to evaluate the cost-effectiveness of their training efforts, allocate resources, and make data-driven decisions to optimize their training budgets.
Calculation Formula:
The calculation of the cost of training per employee can be done using the following formula:
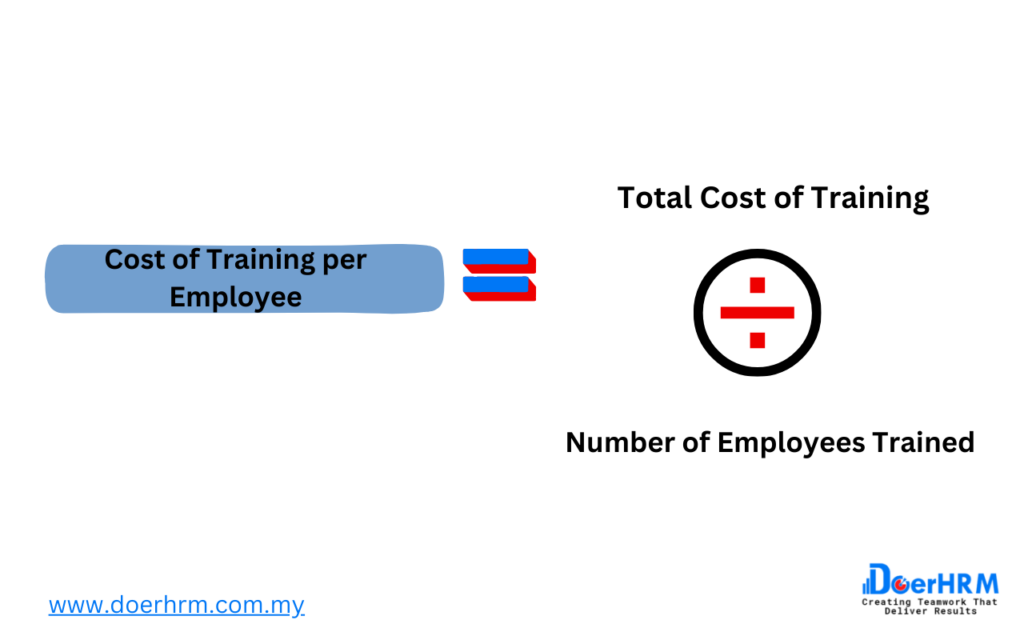
Cost of Training per Employee = Total Cost of Training / Number of Employees Trained
The total cost of training includes all the costs associated with designing, delivering, and administering training programs, such as trainers’ salaries, training materials, training software or platforms, facilities, travel expenses, and other related costs. The number of employees trained is the total number of employees who participated in the training programs during a specific period.
Example:
Let’s take an example of an organization that spent $100,000 on various training programs, workshops, and certifications during a year. A total of 200 employees participated in these training initiatives.
Using the above formula, we can calculate the cost of training per employee as follows:
Cost of Training per Employee = $100,000 / 200 = $500 per employee
This means that, on average, the organization spent $500 per employee on training and development during the year.
Measuring the cost of training per employee helps organizations evaluate the cost-effectiveness of their training programs, identify areas for improvement, and make informed decisions on resource allocation for training initiatives. It also allows organizations to benchmark their training costs against industry standards or previous years’ results, and track changes in training costs over time.
In conclusion, tracking the cost of training per employee is essential for HR managers and executives to assess the efficiency and effectiveness of their training programs, and ensure that their training initiatives are aligned with the organization’s strategic objectives and budgetary constraints. It helps organizations optimize their training budgets, improve the quality of training programs, and enhance the overall performance and development of their employees.
Related article : What Is A KPI & How To Develop It Effectively
HR KPI 12: Succession Planning
Definition and Importance:
Succession planning is a strategic HR KPI metric that involves identifying and developing potential future leaders within an organization. It is a proactive approach to ensure that there is a pipeline of qualified and capable employees who can step into key leadership positions in case of retirement, resignation, or any other unforeseen events. Succession planning is crucial for organizations to maintain continuity, sustain performance, and minimize disruptions caused by leadership changes.
Succession planning is important as it helps organizations mitigate risks associated with leadership gaps and ensures a smooth transition of leadership positions. It allows organizations to identify and groom high-potential employees who can step into leadership roles, aligning with the organization’s long-term goals and strategic vision. Succession planning also enhances employee engagement and motivation, as it provides employees with a clear career development path and a sense of purpose within the organization.
Calculation Formula:
The calculation of succession planning as an HR KPI metric typically does not involve numerical calculations or formulas. Instead, it involves a qualitative assessment of the organization’s succession planning efforts, such as the number of identified successors, the quality of their development plans, and the progress made in grooming them for leadership positions. The HR department can use surveys, assessments, and other qualitative methods to evaluate the effectiveness of succession planning efforts within the organization.
Example:
Let’s take an example of a large multinational company that has a comprehensive succession planning program in place. The HR department identifies and assesses high-potential employees across different departments and levels, and provides them with personalized development plans to prepare them for leadership roles. The HR department conducts regular assessments to track the progress of these identified successors and provides them with mentoring, coaching, and other developmental opportunities.
The HR department evaluates the effectiveness of the succession planning program through surveys and assessments. They assess the quality of the development plans, the progress made by the identified successors, and their readiness to assume leadership positions. They also gather feedback from current leaders and other stakeholders to assess the impact of the succession planning program on the organization’s performance and leadership continuity.
Based on the qualitative assessments and feedback, the HR department can identify areas for improvement, such as enhancing the quality of development plans, providing additional resources for succession planning efforts, or addressing any gaps in leadership development. The HR department can also track the progress of the identified successors over time and measure their success in assuming leadership roles within the organization.
In conclusion, succession planning is a critical HR KPI metric that ensures leadership continuity, minimizes risks associated with leadership gaps, and enhances employee engagement and motivation. While there may not be a specific calculation formula for succession planning, qualitative assessments and feedback from various stakeholders can help organizations evaluate the effectiveness of their succession planning efforts and make data-driven decisions to optimize their leadership development strategies.
Related article : How To Create A Marketing KPI Dashboard
HR KPI 13: HR to Employee Ratio
Definition and Importance
HR to Employee Ratio is a crucial HR KPI metric that measures the ratio of HR personnel to the total number of employees in an organization. It provides insights into the efficiency and effectiveness of the HR department’s ability to manage and support the workforce. A higher HR to Employee Ratio may indicate that the HR department is understaffed and may struggle to meet the needs of the employees, resulting in decreased HR service quality and employee satisfaction. On the other hand, a lower HR to Employee Ratio may indicate that the HR department is overstaffed, leading to unnecessary costs.
Calculation Formula
The calculation formula for HR to Employee Ratio is: HR to Employee Ratio = Total number of HR personnel / Total number of employees
Example
Let’s say an organization has 4 HR personnel and a total of 100 employees. The HR to Employee Ratio would be: HR to Employee Ratio = 4 / 100 = 0.04
This means that the organization has 1 HR personnel for every 25 employees, indicating a HR to Employee Ratio of 0.04 or 4%.
HR KPI 14: Time to Promotion
Definition and Importance
Time to Promotion is a key HR KPI that measures the average time it takes for employees to receive a promotion within the organization. It is an important metric as it indicates the effectiveness of the organization’s talent management and career development strategies. A shorter time to promotion can signify a culture of growth, development, and recognition, which can lead to higher employee motivation, engagement, and retention. On the other hand, a longer time to promotion may indicate a lack of career progression opportunities or a slow advancement process, which can negatively impact employee morale and satisfaction.
Calculation Formula
The formula to calculate Time to Promotion is as follows: Time to Promotion = (Total time spent by employees in their current position) / (Total number of employees promoted)
Example
Let’s consider an example to illustrate the calculation of Time to Promotion. Suppose an organization has 100 employees and the total time spent by employees in their current position is 800 months. In the given time period, a total of 20 employees were promoted to higher positions. Using the formula mentioned above:
Time to Promotion = (800 months) / (20 employees) = 40 months per promotion
This means, on average, employees in this organization take 40 months to receive a promotion.
HR KPI 15: HR Budget Variance
Definition and Importance
HR Budget Variance is a key HR KPI that measures the variance between the actual HR expenses incurred and the budgeted HR expenses. It is an important metric as it helps HR managers and executives to monitor and control HR expenses effectively. By comparing actual expenses with budgeted expenses, HR managers can identify any deviations and take necessary actions to align HR spending with the budgeted targets. This KPI provides insights into the financial performance of the HR department and helps in making informed decisions related to HR budgeting and financial management.
Calculation Formula
The formula for calculating HR Budget Variance is as follows: HR Budget Variance = Actual HR Expenses – Budgeted HR Expenses
Example
Let’s say the budgeted HR expenses for a particular quarter were $100,000 and the actual HR expenses incurred during the same period were $95,000. The HR Budget Variance would be calculated as follows: HR Budget Variance = $95,000 – $100,000 = -$5,000
In this example, the negative value indicates that the actual HR expenses were lower than the budgeted expenses, resulting in a budget variance of -$5,000.
HR KPI 16: Time to Resignation
Definition and importance
Time to Resignation is a key HR KPI that measures the amount of time an employee spends in the company before resigning. It is an important metric to track as it provides insights into employee retention and turnover rates. A high Time to Resignation may indicate that employees are leaving the organization too soon, which could be a sign of dissatisfaction, lack of engagement, or other underlying issues. On the other hand, a low Time to Resignation may indicate that employees are staying with the organization for longer periods, which could be a positive sign of employee satisfaction, engagement, and loyalty.
Calculation formula
The calculation formula for Time to Resignation is relatively simple. It is the average duration in days between the date of hire and the date of resignation for employees who have resigned during a specific period of time. The formula is as follows:
Time to Resignation = (Sum of days between resignation date and hire date for all resigned employees) / (Total number of resigned employees)
Example
Let’s consider an example to illustrate the calculation of Time to Resignation. Suppose an organization has 100 employees who resigned during a given year. The sum of days between resignation date and hire date for all these employees is 1,500 days. Using the formula mentioned above, we can calculate the Time to Resignation as follows:
Time to Resignation = 1,500 days / 100 employees = 15 days
This means that, on average, employees resigned from the organization after spending 15 days in the company during the specified period.
It’s worth noting that the time period for which Time to Resignation is calculated can vary depending on the organization’s needs and context. It can be calculated on a monthly, quarterly, annual, or other time basis, depending on the organization’s HR data availability and reporting requirements.
Tracking and analyzing Time to Resignation can provide valuable insights for HR managers and executives to identify patterns and trends related to employee turnover. For instance, if Time to Resignation is consistently low, it may suggest that employees are leaving the organization too soon, and HR may need to investigate and address underlying issues related to employee satisfaction, engagement, or retention strategies. On the other hand, if Time to Resignation is consistently high, it may indicate that employees are staying with the organization for longer periods, which may be a positive sign of employee satisfaction and loyalty.
HR KPI 17: Employee Referral Rate
Definition and importance The employee referral rate is a key HR KPI that measures the percentage of new hires that come from employee referrals. It is calculated by dividing the number of new hires who were referred by current employees by the total number of new hires during a specific period, and multiplying by 100 to get the percentage. Employee referral programs are increasingly popular in organizations as they tend to result in higher-quality hires, better cultural fit, and improved retention rates. Therefore, tracking the employee referral rate can help HR managers assess the effectiveness of their referral programs and make data-driven decisions to optimize their hiring strategies.
Calculation formula
The employee referral rate can be calculated using the following formula:
Employee Referral Rate = (Number of New Hires from Employee Referrals / Total Number of New Hires) x 100
Example
Let’s say that during a quarter, a company hired a total of 50 new employees, and 15 of them were referred by current employees. To calculate the employee referral rate, we would plug in these numbers into the formula:
Employee Referral Rate = (15 / 50) x 100 = 30%
This means that 30% of the new hires during that quarter were referred by current employees.
HR KPI 18: Cost of Turnover per Employee
Definition and importance
The cost of turnover per employee is the financial cost incurred when an employee leaves the organization and needs to be replaced. The importance of measuring this metric lies in the fact that high turnover can be a significant drain on an organization’s resources, including time, money, and productivity. This cost can be direct, such as the cost of recruiting and training a new employee, or indirect, such as the cost of lost productivity while the position remains unfilled, the cost of lost knowledge and experience, and the potential impact on employee morale.
Calculation formula
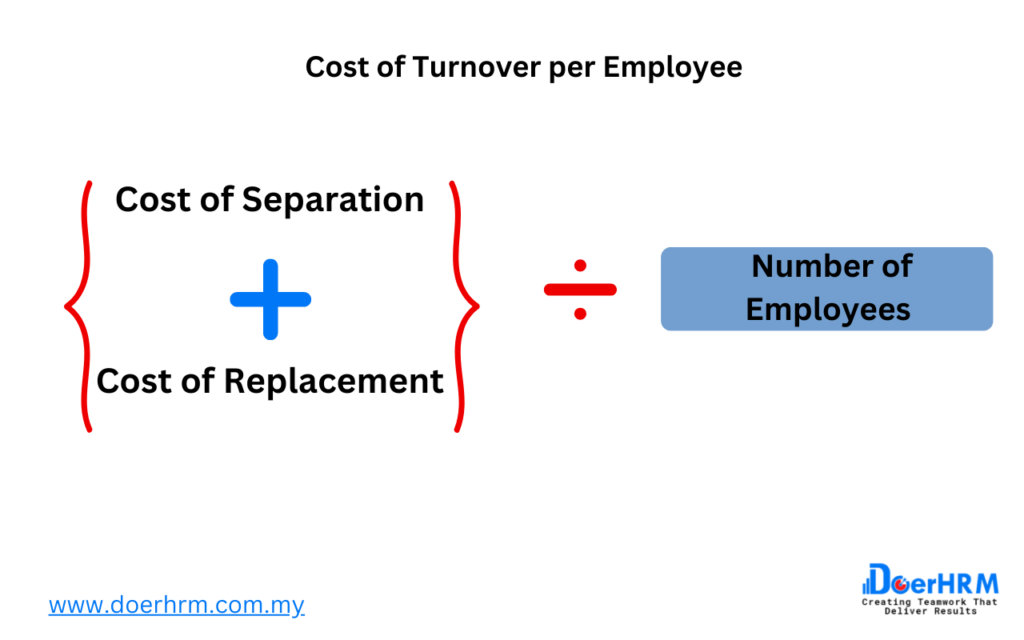
The formula for calculating the cost of turnover per employee is:
(Cost of Separation + Cost of Replacement) / Number of Employees
The Cost of Separation includes any costs associated with the employee leaving, such as severance pay, accrued vacation pay, and any other termination benefits. The Cost of Replacement includes costs associated with filling the vacant position, such as recruiting, advertising, interviewing, and training.
Example
Let’s say that an organization has 100 employees and experiences a turnover rate of 20% over the course of a year. During that year, they incurred $50,000 in separation costs and $100,000 in replacement costs.
To calculate the cost of turnover per employee, we would use the following formula:
($50,000 + $100,000) / 100 = $1,500
This means that, on average, the cost of replacing each employee who left the organization was $1,500.
By tracking this metric over time, HR managers can determine the impact of employee turnover on the organization’s finances and identify areas for improvement in their employee retention strategies.
HR KPI 19: HR Compliance
Definition and Importance
HR compliance refers to ensuring that an organization’s policies, procedures, and practices comply with relevant laws and regulations. The importance of HR compliance lies in avoiding potential legal liabilities that can arise from non-compliance. HR compliance covers a wide range of areas, including employment laws, workplace safety regulations, data privacy, and security, and compensation and benefits.
Measuring HR compliance through KPIs can help organizations ensure that their HR policies and practices are in compliance with legal and regulatory requirements. This can include tracking metrics such as the number of employment law violations, data breaches, workplace safety incidents, and employee complaints.
Calculation Formula
The calculation of HR compliance KPIs depends on the specific area of compliance being measured. For example, to measure compliance with employment laws, an organization can calculate the number of legal violations per year, as well as the cost of any legal settlements or fines. To measure compliance with data privacy regulations, an organization can track the number of data breaches and the associated costs of remediation and legal penalties.
Example
One example of an HR compliance KPI is the number of workplace safety incidents. An organization can track the number of workplace accidents and injuries per year and calculate the associated costs of lost workdays, medical expenses, and legal liabilities. By setting a target for reducing the number of workplace safety incidents, organizations can ensure compliance with relevant regulations and improve employee safety and well-being.
Another example of an HR compliance KPI is the number of data breaches. Organizations can track the number of data breaches per year and calculate the associated costs of remediation, legal penalties, and reputational damage. By setting a target for reducing the number of data breaches, organizations can ensure compliance with data privacy regulations and protect sensitive employee and customer information.
HR KPI 20: Employee Advocacy
Definition and Importance
Employee Advocacy is a measure of the extent to which employees actively promote and support their organization’s brand, products, or services. It reflects the level of engagement and loyalty employees have towards their organization, and their willingness to act as brand ambassadors in their interactions with customers, partners, and other stakeholders. Employee Advocacy is a critical HR KPI as it can positively impact the organization’s reputation, customer satisfaction, and business outcomes.
Calculation Formula
There is no specific formula to calculate Employee Advocacy, as it is a qualitative measure that requires subjective assessment. However, organizations can design surveys or use social media monitoring tools to gather feedback from employees on their willingness to advocate for the organization and its products/services. This feedback can then be used to calculate an Employee Advocacy score or index.
Example
Let’s consider an example to illustrate how Employee Advocacy can be measured. An organization can design a survey that asks employees to rate their level
Importance of HRMS in measuring HR KPIs
Human resource management systems (HRMS) are essential tools for managing and measuring HR KPIs. An HRMS is a software solution that helps companies manage HR-related tasks, including payroll, employee benefits, and training and development. By automating many HR tasks, an HRMS can free up HR managers’ time to focus on strategic initiatives such as measuring and analyzing HR KPIs.
One of the main benefits of using an HRMS to measure HR KPIs is the ability to collect and analyze data in real-time. Traditional HR methods involve manual data entry and time-consuming analysis, which can be prone to errors. With an HRMS, data is automatically collected and stored, reducing the likelihood of errors and enabling HR managers to access up-to-date information at any time.
Another benefit of using an HRMS for HR KPIs is the ability to customize reports and dashboards. HR managers can create reports and dashboards that display the data and metrics most relevant to their organization. They can also customize reports and dashboards based on department, location, or job function, providing a more tailored view of HR KPIs.
HRMS software such as DoerHRM is designed specifically for measuring and tracking HR KPIs. DoerHRM software can track and analyze data across multiple HR KPIs, including employee turnover rate, time to hire, cost per hire, absenteeism rate, training and development, employee engagement, time to productivity, diversity and inclusion, employee satisfaction, employee retention, cost of training per employee, succession planning, HR to employee ratio, time to promotion, HR budget variance, time to resignation, employee referral rate, and cost of turnover per employee.
Conclusion
In conclusion, HR KPIs are essential for measuring HR department performance, and an HRMS is a crucial tool for automating data collection, reducing errors, and analyzing data in real-time. DoerHRM software provides HR managers with a comprehensive suite of HR KPIs and reporting tools, enabling them to make data-driven decisions and improve HR department performance.