Tracking business performance is essential for the success of any organization. It allows businesses to measure their progress, identify areas of improvement, and make informed decisions to achieve their objectives. Key Performance Indicators (KPIs) are a set of metrics that organizations use to track and evaluate their performance. KPI scorecards are tools that businesses use to monitor their progress towards achieving their goals.
This article will discuss the importance of tracking business performance and the role of KPI scorecards in achieving this objective. It will also provide an overview of the article’s structure, which includes a detailed explanation of KPIs and scorecards, the benefits of using KPI scorecards, and the steps involved in creating a KPI scorecard. Additionally, the article will offer some tips for effectively using KPI scorecards and some common mistakes to avoid when implementing KPI scorecards. Finally, it will conclude with a summary of the main points covered in the article.
Related article : What is a Key Performance Indicator (KPI)? Meaning, Templates, Examples
Table of Contents
What are KPI Scorecards?
Definition and explanation of KPI scorecards
KPI scorecards are tools used by organizations to monitor their performance against key business objectives. They are visual representations of key performance indicators (KPIs) that provide a clear, concise, and easy-to-understand view of an organization’s performance. KPI scorecards help businesses to identify areas of strength and weakness and to make data-driven decisions to improve their overall performance.
A KPI scorecard typically includes a set of KPIs that are relevant to the organization’s goals and objectives. KPIs are metrics that measure how well an organization is performing against its objectives. They are often used to assess performance over time and to compare performance with other organizations in the same industry.
KPI scorecards may be designed for different levels of the organization, from the overall company to individual departments or teams. They may also be used to track performance over different time periods, such as weekly, monthly, or quarterly.
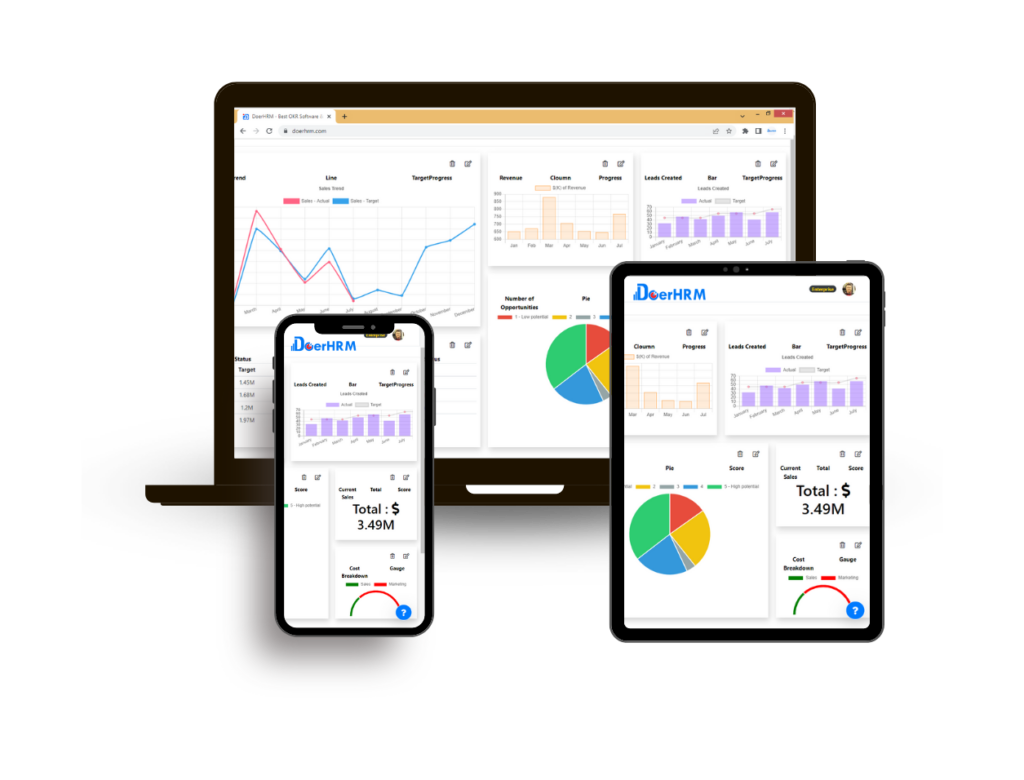
KPI scorecards are typically presented in a graphical format, such as a dashboard, to make it easier for users to quickly and easily understand the organization’s performance. They may include charts, graphs, tables, and other visual aids to help users identify trends and patterns in the data.
Overall, KPI scorecards are valuable tools for monitoring and improving organizational performance. By tracking key performance indicators and presenting them in an easily accessible format, organizations can make informed decisions to improve their operations and achieve their strategic objectives.
Related article : Top 20 HR KPI Metrics & Examples for Human Resource Manager, Executive, Department – HRMS
Benefits of using KPI scorecards to track business performance
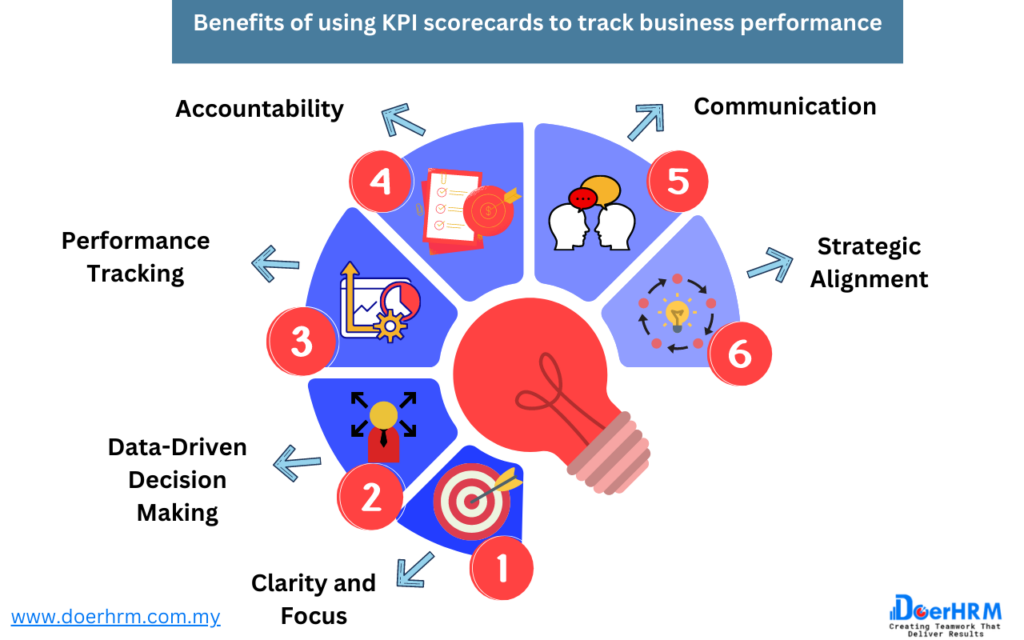
Using KPI scorecards to track business performance offers numerous benefits, including:
Clarity and Focus: KPI scorecards provide a clear and focused view of an organization’s performance. By tracking key metrics, businesses can identify areas of strength and weakness and focus on improving performance in areas that are critical to achieving their objectives.
Data-Driven Decision Making: KPI scorecards provide businesses with data to make informed decisions. By tracking performance metrics, businesses can make decisions based on objective data rather than intuition or guesswork.
Performance Tracking: KPI scorecards allow businesses to track performance over time. By monitoring KPIs regularly, businesses can identify trends and patterns and make adjustments to their operations to improve performance.
Accountability: KPI scorecards help to promote accountability within an organization. By tracking performance metrics, businesses can hold individuals and teams accountable for meeting their objectives and contributing to the overall success of the organization.
Communication: KPI scorecards facilitate communication within an organization. By presenting data in a clear and concise manner, businesses can easily share performance information with stakeholders and make sure everyone is on the same page.
Strategic Alignment: KPI scorecards ensure that business activities are aligned with strategic objectives. By tracking metrics that are directly tied to strategic goals, businesses can ensure that their operations are moving in the right direction and making progress towards their long-term objectives.
Overall, using KPI scorecards to track business performance offers numerous benefits that can help businesses improve their operations, make data-driven decisions, and achieve their strategic objectives.
Related article : Top 11 Important Training KPIs HR Managers Should Have
How KPI scorecards differ from other types of scorecards
KPI scorecards are a specific type of scorecard that differs from other types of scorecards in several ways. Here are a few key differences:
Focus on Key Performance Indicators: Unlike other scorecards that may track a wide range of metrics, KPI scorecards focus specifically on key performance indicators that are critical to achieving an organization’s strategic objectives. KPIs are selected based on their relevance to the organization’s goals and are tracked consistently over time to ensure progress is being made.
Focus on Business Performance: KPI scorecards are designed to track business performance, such as revenue growth, customer satisfaction, and employee productivity. Other types of scorecards may focus on specific areas of the business, such as marketing or finance.
Visual Representation: KPI scorecards are presented in a visual format, such as a dashboard, to make it easy for users to quickly and easily understand the organization’s performance. Other types of scorecards may be presented in a tabular format or require additional analysis to interpret the data.
Strategic Alignment: KPI scorecards are directly aligned with an organization’s strategic objectives, ensuring that business activities are focused on achieving these goals. Other types of scorecards may be more focused on operational or tactical goals.
Focus on Continuous Improvement: KPI scorecards are designed to track performance over time and identify areas of improvement. They are used to promote continuous improvement and make data-driven decisions to optimize business performance. Other types of scorecards may be more focused on tracking specific activities or projects.
Overall, KPI scorecards differ from other types of scorecards in their focus on key performance indicators, business performance, visual representation, strategic alignment, and focus on continuous improvement. These differences make KPI scorecards a valuable tool for monitoring and improving business performance.
Related article : Practical KPI Examples

Creating a KPI Scorecard
Step-by-step guide to creating a KPI scorecard
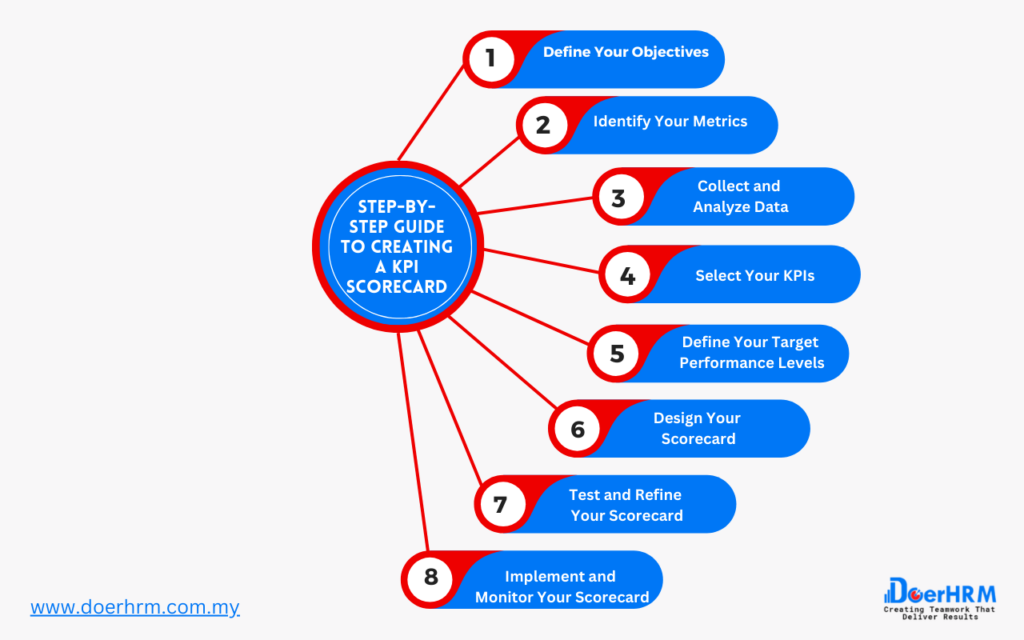
Creating a KPI scorecard involves several steps. Here is a step-by-step guide to creating a KPI scorecard:
Define Your Objectives: The first step in creating a KPI scorecard is to define your objectives. Identify the strategic goals and objectives you want to achieve, and determine the KPIs that are most relevant to those objectives.
Identify Your Metrics: Once you have defined your objectives, identify the metrics you will use to measure your performance. These metrics should be specific, measurable, and tied directly to your objectives.
Collect and Analyze Data: Collect data on your chosen metrics and analyze it to gain insights into your performance. Use data visualization tools, such as charts and graphs, to help you easily understand the data and identify trends.
Select Your KPIs: Select the KPIs that are most relevant to your objectives and use them to create your scorecard. Your scorecard should include both leading indicators, which predict future performance, and lagging indicators, which measure past performance.
Define Your Target Performance Levels: Define your target performance levels for each KPI, based on your objectives and industry benchmarks. Your targets should be realistic and achievable, but also challenging enough to drive improvement.
Design Your Scorecard: Design your scorecard to make it visually appealing and easy to understand. Use graphs, charts, and other visual aids to help you quickly see trends and patterns in your data.
Test and Refine Your Scorecard: Test your scorecard with key stakeholders and refine it based on their feedback. Ensure that your scorecard is easy to use and provides relevant insights into your performance.
Implement and Monitor Your Scorecard: Implement your scorecard and monitor your performance over time. Regularly review your scorecard to identify areas for improvement and make data-driven decisions to optimize your performance.
By following these steps, you can create a KPI scorecard that provides a clear and focused view of your organization’s performance, helping you to make informed decisions and achieve your strategic objectives.
Related article : Sales KPI: 28 Metrics for Sales Manager – Examples, Meaning, Template, Dashboard
Explanation of the different components of a KPI scorecard
A KPI scorecard typically consists of several key components that provide a comprehensive view of an organization’s performance. Here are some of the most common components of a KPI scorecard:
KPIs: Key Performance Indicators (KPIs) are the core of a KPI scorecard. They are the specific metrics that are used to measure an organization’s performance against its strategic objectives. KPIs should be specific, measurable, and aligned with the organization’s goals.
Targets: Targets are the performance levels that an organization wants to achieve for each KPI. Targets should be based on the organization’s strategic objectives and should be challenging but achievable.
Actual Performance: Actual performance refers to the actual results achieved for each KPI. This is typically represented as a numerical value or percentage.
Trends: Trends show the direction in which an organization’s performance is moving over time. Trends can be represented graphically to help users quickly understand how performance is changing.
Red/Yellow/Green Status: A Red/Yellow/Green (RYG) status indicator provides a quick visual representation of whether performance is meeting or exceeding targets. Red typically indicates that performance is below target, yellow indicates that performance is close to target, and green indicates that performance is meeting or exceeding targets.
Comments/Notes: Comments and notes provide additional context to help users understand the factors that are driving performance. This can help users make informed decisions about how to improve performance.
Data Sources: Data sources identify where the data used to calculate each KPI comes from. This is important for transparency and to ensure that users understand the quality and reliability of the data.
Action Plan: An action plan outlines the steps that an organization will take to improve performance. This should be based on the insights gained from the KPI scorecard.
Overall, a KPI scorecard should be designed to provide a clear and comprehensive view of an organization’s performance, helping users to make informed decisions and drive continuous improvement.
Related article : Marketing KPI: 25 Digital Marketing Key Performance Indicators for Sales & Marketing- Manager, Department, Examples
Tips for choosing the right KPIs to track
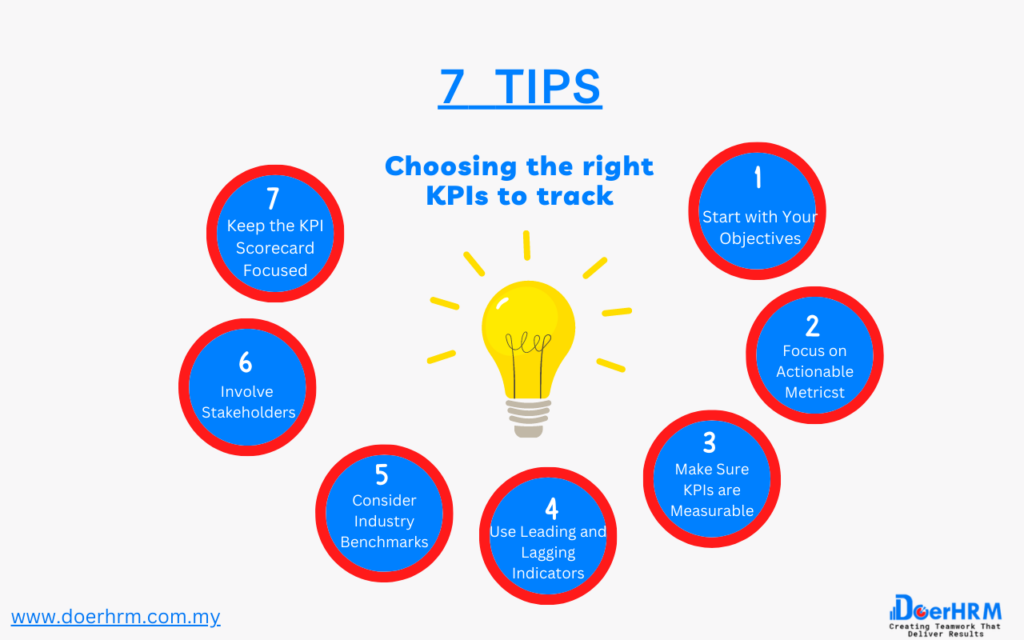
Choosing the right KPIs to track is essential for creating an effective KPI scorecard. Here are some tips for choosing the right KPIs to track:
Start with Your Objectives: Begin by identifying your organization’s strategic objectives. This will help you determine which KPIs are most relevant to your goals.
Focus on Actionable Metrics: Choose KPIs that can be directly influenced by actions taken within your organization. Actionable metrics are the ones that you can control and improve.
Make Sure KPIs are Measurable: Ensure that the KPIs you choose are measurable, so you can track progress over time. If a KPI cannot be measured, it cannot be managed.
Use Leading and Lagging Indicators: Include both leading and lagging indicators in your KPI scorecard. Leading indicators provide insight into future performance, while lagging indicators track past performance.
Consider Industry Benchmarks: Compare your performance to industry benchmarks to determine whether your organization is performing well relative to competitors.
Involve Stakeholders: Involve key stakeholders, such as employees, customers, and partners, in the process of choosing KPIs. This can help ensure that you select KPIs that are relevant and meaningful to all stakeholders.
Keep the KPI Scorecard Focused: Limit the number of KPIs you track to avoid overwhelming users with too much data. Focus on the most critical KPIs that are essential to achieving your objectives.
By following these tips, you can choose the right KPIs to track, ensuring that your KPI scorecard provides meaningful insights into your organization’s performance and helps drive continuous improvement.
Related article : Why KPIs Are Important: 10 Reason Key Performance Indicators Stands For? -Meaning, Examples ,Template

KPI Scorecard Templates
Overview of different KPI scorecard templates available
There are several different KPI scorecard templates available, each designed to provide a different level of detail and complexity. Here are some of the most common KPI scorecard templates:
Basic KPI Scorecard: This is a simple, one-page scorecard that provides an overview of an organization’s performance. It typically includes a few key KPIs, their targets, and actual performance, along with a RYG status indicator.
Balanced Scorecard: This is a more comprehensive scorecard that provides a balanced view of an organization’s performance across multiple perspectives, such as financial, customer, internal processes, and learning and growth. The Balanced Scorecard typically includes more KPIs and a more detailed analysis of each KPI.
Strategy Map: A strategy map is a visual representation of an organization’s strategy that helps to link strategic objectives to KPIs. It provides a clear picture of how different objectives are interrelated and how they contribute to the overall success of the organization.
Dashboard: A dashboard is a customizable, real-time display of KPIs and other important metrics. Dashboards are often interactive, allowing users to drill down into data to gain deeper insights.
Executive Scorecard: An executive scorecard is a high-level view of an organization’s performance, designed for use by senior executives. It typically includes a small number of KPIs that are most critical to the success of the organization, along with additional commentary and insights.
Project Scorecard: A project scorecard is a scorecard designed to track the performance of specific projects or initiatives. It typically includes KPIs related to project timelines, budget, quality, and stakeholder satisfaction.
By choosing the right KPI scorecard template for your organization, you can create a customized scorecard that provides the level of detail and complexity you need
Relate article: KPI for Finance Department: 26 Essential Metrics to Monitor for Finance Manager with Examples
Comparison of the advantages and disadvantages of different templates
- Basic KPI Scorecard:
Advantages:
- Easy to create and understand.
- Provides a simple overview of performance.
- Requires minimal data and analysis.
Disadvantages:
- Lacks detail and may not provide enough information for strategic decision-making.
- May not be suitable for more complex organizations or industries.
- Balanced Scorecard:
Advantages:
- Provides a comprehensive view of performance across multiple perspectives.
- Helps organizations align their strategy with their operations.
- Provides a framework for measuring progress towards strategic goals.
Disadvantages:
- May be complex and time-consuming to develop.
- Requires a significant amount of data and analysis.
- May require significant resources to implement and maintain.
- Strategy Map:
Advantages:
- Provides a clear picture of how different objectives are interrelated and contribute to the overall success of the organization.
- Helps organizations communicate their strategy to stakeholders.
- Enables organizations to focus on achieving their strategic goals.
Disadvantages:
- May require significant resources to develop and maintain.
- May be complex and difficult to understand for some stakeholders.
- Dashboard:
Advantages:
- Provides real-time, customizable displays of KPIs and other important metrics.
- Enables users to drill down into data to gain deeper insights.
- Allows organizations to monitor performance in real-time and make quick decisions based on data.
Disadvantages:
- May require significant resources to develop and maintain.
- Requires ongoing data collection and analysis to ensure accuracy.
- May be overwhelming for some stakeholders due to the amount of data displayed.
- Executive Scorecard:
Advantages:
- Provides a high-level view of performance that is easy for executives to understand.
- Focuses on the most critical KPIs for the organization.
- Provides additional commentary and insights to help executives make strategic decisions.
Disadvantages:
- May not provide enough detail for some stakeholders.
- May not be suitable for organizations with complex operations or multiple business units.
- Project Scorecard:
Advantages:
- Enables project managers to track the performance of specific projects or initiatives.
- Provides KPIs related to project timelines, budget, quality, and stakeholder satisfaction.
- Enables project managers to make adjustments as necessary to ensure project success.
Disadvantages:
- May not be suitable for organizations that do not have a significant number of projects or initiatives.
- May require significant resources to develop and maintain.
Overall, the best KPI scorecard template for your organization will depend on your specific needs and resources. It’s important to consider factors such as the level of detail required, the amount of data available, and the level of complexity of your organization’s operations when choosing a template.
Recommendations for selecting the right template for your business
Determine your business needs: Start by identifying the specific needs of your business. What KPIs are most important for measuring success? Which areas of your business require the most focus? What is the scope of your operations? Understanding your business needs will help you determine which KPI scorecard template will be most effective.
Consider your resources: KPI scorecard templates vary in terms of the resources required to develop and maintain them. Consider factors such as the availability of data, the level of expertise required to analyze and interpret the data, and the amount of time and resources your organization is willing to dedicate to the scorecard.
Evaluate the complexity of your business: The complexity of your business operations will also impact the choice of KPI scorecard template. For example, if your business has a simple structure and operations, a basic KPI scorecard template may suffice. However, if your business is more complex, such as having multiple business units or operating in multiple countries, a more comprehensive template such as a balanced scorecard or strategy map may be necessary.
Determine your audience: Who will be using the KPI scorecard and what level of detail do they require? If the scorecard is intended for executives, a more high-level executive scorecard may be appropriate. However, if the scorecard is intended for project managers or operational teams, a project scorecard or dashboard may be more effective.
Customize the template to fit your needs: Once you have selected a KPI scorecard template, customize it to fit your specific needs. Add or remove KPIs as needed, adjust the format to fit your branding, and ensure that the data is relevant and accurate.
By taking these recommendations into account, you can select the right KPI scorecard template for your business and effectively track your performance over time.
Related article : Customer Service KPI: 20 Metrics To Measure Team Performance – Meaning, Examples, Templates, and Dashboard

KPI Scorecard Dashboards
Explanation of KPI scorecard dashboards and their advantages
KPI scorecard dashboards are a visual representation of the KPI scorecard that display key metrics and performance data in real-time. They allow for quick and easy monitoring of business performance and help users to identify trends and potential issues at a glance. Here are some advantages of using KPI scorecard dashboards:
Real-time insights: KPI scorecard dashboards provide real-time data on business performance, allowing users to make informed decisions quickly.
Visual representation: KPI scorecard dashboards provide a visual representation of performance data, making it easier to understand and identify trends and patterns.
Customizable: KPI scorecard dashboards can be customized to display the most relevant KPIs for your business, making it easier to focus on what matters most.
User-friendly: KPI scorecard dashboards are user-friendly and easy to use, with interactive features such as drill-downs and filters.
Mobile access: KPI scorecard dashboards can be accessed from any device, including mobile devices, making it easier to stay connected to performance data on-the-go.
Overall, KPI scorecard dashboards are a powerful tool for businesses looking to track their performance and make informed decisions. They provide a comprehensive view of business performance in real-time, and their user-friendly interface makes it easy for users at all levels of the organization to access and interpret data.
Related article : KPI In Project Management : KPIs In Agile For Planning Project Management – A Consultant’s Guide With Examples
Overview of different types of KPI scorecard dashboards
There are several different types of KPI scorecard dashboards that businesses can use to track their performance. Here are some of the most common types:
Executive dashboard: Executive dashboards are designed for high-level executives and provide a summary of key metrics related to the organization’s overall performance. They typically include visualizations of KPIs such as revenue, profit margins, and customer satisfaction.
Operational dashboard: Operational dashboards are designed for operational teams and provide a real-time view of performance data relevant to specific business functions, such as sales or production. They typically include KPIs related to process efficiency, quality control, and cost management.
Project dashboard: Project dashboards are designed for project managers and provide a real-time view of project performance data, including timelines, budgets, and resource allocation. They typically include KPIs related to project completion rates, budget variances, and resource utilization.
Balanced scorecard: A balanced scorecard dashboard provides a comprehensive view of performance data across multiple business functions, such as finance, customer service, and internal processes. It includes both financial and non-financial KPIs, providing a holistic view of organizational performance.
Strategy map: A strategy map dashboard is similar to a balanced scorecard, but it focuses specifically on the organization’s strategic objectives and how they are being achieved. It includes KPIs related to each strategic objective, providing a clear picture of progress towards achieving the organization’s goals.
Overall, businesses can choose from a variety of KPI scorecard dashboard types depending on their specific needs and the level of detail required to track performance. By selecting the right dashboard, businesses can improve decision-making, increase efficiency, and achieve better results.
Best practices for creating an effective KPI scorecard dashboard
Here are some best practices for creating an effective KPI scorecard dashboard:
Define your objectives: Start by defining your objectives and identifying the key performance indicators (KPIs) that are most relevant to achieving them. Choose KPIs that are specific, measurable, and aligned with your business goals.
Keep it simple: Avoid cluttering your dashboard with too much information. Instead, focus on the most important KPIs and present them in a clear, easy-to-understand format. Use charts, graphs, and other visual aids to make the data more engaging and accessible.
Use real-time data: To ensure that your dashboard is up-to-date and relevant, use real-time data whenever possible. This will allow you to make more informed decisions and respond quickly to changes in your business environment.
Customize for your audience: Different stakeholders may have different needs and preferences when it comes to viewing KPI data. Customize your dashboard to suit your audience, whether it’s executives, managers, or front-line employees.
Focus on trends: Rather than just looking at current performance data, focus on trends over time. This will allow you to identify patterns and make more accurate predictions about future performance.
Ensure data accuracy: It’s important to ensure that the data you’re presenting on your dashboard is accurate and up-to-date. Invest in robust data management systems and processes to minimize errors and ensure data integrity.
Use benchmarking: Benchmarking your KPI data against industry averages or competitor performance can provide valuable context and help you identify areas for improvement.
By following these best practices, businesses can create KPI scorecard dashboards that are informative, engaging, and effective at driving performance improvement.
Related article : SMART KPI : What Is Smart KPIs And How To Use It In Business – Meaning , Examples, Dashboard And Template

Examples of KPI Scorecards
Case studies of businesses that have successfully implemented KPI scorecards
Here are a few examples of businesses that have successfully implemented KPI scorecards:
Google: Google uses a variety of KPIs to track its business performance, including user engagement metrics such as time on site, pageviews per visit, and bounce rate. Google also tracks revenue per user and advertising revenue, as well as employee satisfaction and retention rates.
FedEx: FedEx uses a KPI scorecard to track its operational performance, with metrics such as on-time delivery, package volume, and customer satisfaction. The company also tracks employee safety and productivity metrics to ensure that its operations are efficient and safe.
Marriott International: Marriott uses KPIs to track guest satisfaction, revenue per available room, and occupancy rates across its global hotel network. The company also tracks employee engagement and retention rates to ensure that its staff is motivated and performing at a high level.
Nike: Nike uses KPIs to track sales performance across its product lines, as well as marketing metrics such as social media engagement and brand awareness. The company also tracks supply chain metrics such as on-time delivery and inventory turnover to ensure that its operations are efficient and cost-effective.
In each of these examples, KPI scorecards have played an important role in driving business performance and helping these companies achieve their goals. By tracking the right metrics and using the data to inform decision-making, businesses can make more informed decisions and respond quickly to changes in the market.
Analysis of the KPIs they chose to track and why
Google: As a technology company, Google places a strong emphasis on user engagement and revenue growth. By tracking metrics such as time on site, pageviews per visit, and bounce rate, Google can determine which products and services are resonating with users and make adjustments to improve the user experience. Additionally, by tracking revenue per user and advertising revenue, Google can ensure that its monetization strategy is effective.
FedEx: As a logistics company, FedEx focuses on operational performance and customer satisfaction. By tracking metrics such as on-time delivery and package volume, FedEx can ensure that its delivery network is operating efficiently and meeting customer expectations. Additionally, by tracking customer satisfaction, FedEx can identify areas for improvement and make changes to improve the overall customer experience.
Marriott International: As a global hotel chain, Marriott places a strong emphasis on guest satisfaction and revenue growth. By tracking metrics such as revenue per available room and occupancy rates, Marriott can ensure that its properties are operating efficiently and generating revenue. Additionally, by tracking employee engagement and retention rates, Marriott can ensure that its staff is motivated and delivering a high level of service to guests.
Nike: As a leading athletic apparel and footwear brand, Nike tracks a variety of sales and marketing metrics. By tracking sales performance across its product lines, Nike can identify which products are resonating with consumers and adjust its product strategy accordingly. Additionally, by tracking marketing metrics such as social media engagement and brand awareness, Nike can determine which marketing campaigns are effective and make adjustments to its marketing strategy.
In each of these examples, the KPIs chosen to track align with the company’s overall strategy and goals. By tracking these metrics and using the data to inform decision-making, these companies can make more informed decisions and drive business performance.
Discussion of the impact of KPI scorecards on their business performance
Google: By using KPI scorecards to track user engagement and revenue growth, Google has been able to make data-driven decisions and improve its products and services. For example, by tracking bounce rates and time on site, Google can identify which pages on its website are causing users to leave quickly and make changes to improve the user experience. Additionally, by tracking revenue per user and advertising revenue, Google can adjust its monetization strategy to maximize revenue.
FedEx: By using KPI scorecards to track operational performance and customer satisfaction, FedEx has been able to optimize its delivery network and improve the overall customer experience. For example, by tracking on-time delivery and package volume, FedEx can identify which parts of its delivery network are underperforming and make changes to improve efficiency. Additionally, by tracking customer satisfaction, FedEx can identify areas for improvement and make changes to improve the overall customer experience.
Marriott International: By using KPI scorecards to track guest satisfaction and revenue growth, Marriott has been able to improve the guest experience and grow revenue. For example, by tracking occupancy rates and revenue per available room, Marriott can optimize its pricing and availability to maximize revenue. Additionally, by tracking employee engagement and retention rates, Marriott can ensure that its staff is motivated and delivering a high level of service to guests.
Nike: By using KPI scorecards to track sales and marketing metrics, Nike has been able to make data-driven decisions and improve its products and marketing campaigns. For example, by tracking sales performance across its product lines, Nike can identify which products are resonating with consumers and adjust its product strategy accordingly. Additionally, by tracking marketing metrics such as social media engagement and brand awareness, Nike can determine which marketing campaigns are effective and make adjustments to its marketing strategy.
In each of these examples, the use of KPI scorecards has had a positive impact on the business performance of the companies involved. By tracking the right KPIs and using the data to make informed decisions, these companies have been able to improve efficiency, optimize pricing and availability, improve the customer experience, and drive revenue growth.

Why DoerHRM Believes KPI Scorecards are Essential to Track Your Business Performance
DoerHRM– In today’s highly competitive business environment, it’s more important than ever to have a clear understanding of your company’s performance. This is where Key Performance Indicators (KPIs) come into play. KPIs are a set of metrics that help organizations track progress towards specific goals and objectives. KPIs are used across all industries and business functions to measure and monitor performance, and they are especially important in human resources management (HRM). At DoerHRM, we believe that KPI scorecards are essential to track your business performance, and in this article, we’ll explain why.
- KPI Scorecards Provide Clarity
When it comes to HRM, KPIs help organizations measure the success of their HR initiatives, such as recruiting, training, and employee retention. By tracking KPIs on a regular basis, HR managers can identify trends and patterns in their data, which can help them make informed decisions about how to improve their HR strategies. With a KPI scorecard, HR managers can easily see how they are progressing towards their goals and what needs to be adjusted to meet those goals.
- KPI Scorecards Help You Stay on Track
One of the biggest benefits of KPI scorecards is that they help you stay on track towards achieving your goals. By setting KPIs, you have a clear target to aim for, and the scorecard provides a way to monitor your progress towards that target. This helps to keep your team motivated and focused on the most important metrics, which in turn drives better results.
- KPI Scorecards Enable You to Identify Areas for Improvement
KPI scorecards allow you to easily identify areas for improvement in your business. By monitoring your KPIs, you can quickly identify areas where you are falling short and take action to address them. This could involve adjusting your HR strategies, investing in new technology, or providing additional training to your employees.
- KPI Scorecards Enable You to Measure ROI
Finally, KPI scorecards enable you to measure the ROI of your HR initiatives. By tracking KPIs related to HR performance, you can determine whether your investments in recruiting, training, and employee retention are paying off. This information is invaluable when it comes to making decisions about where to allocate resources in the future.
At DoerHRM, we believe that KPI scorecards are essential to track your business performance. By providing clarity, helping you stay on track, enabling you to identify areas for improvement, and enabling you to measure ROI, KPI scorecards are an essential tool for any HR manager. If you’re not already tracking KPIs in your business, it’s time to start.
Conclusion
In conclusion, KPI scorecards are an essential tool for tracking and monitoring business performance. By providing a clear and concise overview of key metrics, KPI scorecards enable businesses to make data-driven decisions, identify areas for improvement, and measure progress towards strategic goals.
When creating a KPI scorecard, it’s important to choose the right KPIs to track and to structure the scorecard in a way that is easily understandable and actionable. Additionally, selecting the right template and dashboard design can further enhance the effectiveness of the KPI scorecard.
Through analyzing case studies of businesses that have successfully implemented KPI scorecards, we can see the impact that they can have on improving business performance. By regularly reviewing and adjusting KPIs, businesses can stay agile and respond quickly to changes in the market.
Overall, we highly recommend that businesses of all sizes and industries start using KPI scorecards today to track their performance, set goals, and ultimately achieve success. With the right KPIs, templates, and dashboards in place, businesses can gain valuable insights into their operations and make data-driven decisions that drive growth and profitability.