Marketing KPI, or key performance indicators, are a set of measurable values used by businesses to assess the success of their marketing strategies. These metrics help organizations track their progress towards achieving their marketing objectives, whether it be increasing website traffic, generating leads, or driving revenue growth.
By measuring marketing metrics, sales and marketing managers can gain valuable insights into the performance of their campaigns and identify areas for improvement. For example, if a company’s cost per acquisition is high, they may need to reassess their targeting or adjust their ad spend to optimize their ROI.
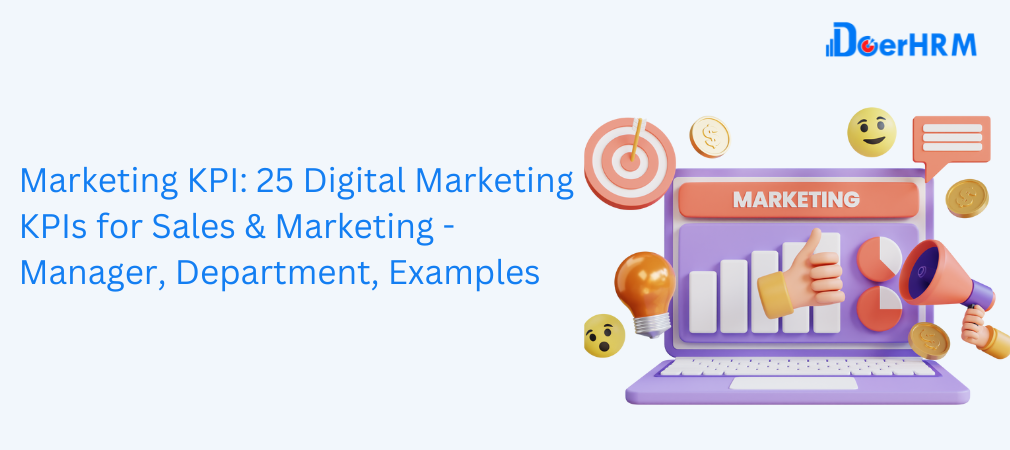
In this article, we will explore 25 digital marketing metrics across five categories: sales, marketing, website, social media, and email marketing. By understanding and tracking these KPIs, businesses can make informed decisions and improve the effectiveness of their marketing efforts.
Related article : What is a Key Performance Indicator (KPI)? Meaning, Templates, Examples
Sales KPIs

1. Revenue growth rate - Marketing KPI
Revenue growth rate is a crucial sales KPI that measures the percentage increase in a company’s revenue over a specific period, typically measured monthly, quarterly, or annually. This KPI helps businesses track the growth of their revenue streams and identify trends in their sales performance.
A positive revenue growth rate indicates that a business is generating more revenue than it did in the previous period, which is a key indicator of business growth and success. On the other hand, a negative revenue growth rate suggests that a business is experiencing a decline in revenue, which may require management to take corrective actions to address underlying issues.
It is worth noting that while revenue growth rate is a useful KPI, it is essential to evaluate it in conjunction with other KPIs, such as customer acquisition costs and customer lifetime value, to get a complete understanding of a company’s financial performance. By analyzing these metrics, businesses can identify areas for improvement, optimize their sales strategies, and ensure long-term growth and success.
Related article : Sales KPI: 28 Metrics for Sales Manager – Examples, Meaning, Template, Dashboard
2. Sales revenue - Marketing KPI
Sales revenue is a crucial sales KPI that measures the total amount of revenue generated by a business through its sales activities. This metric helps businesses understand their revenue streams and the effectiveness of their sales strategies.
To calculate sales revenue, a company multiplies the number of units sold by the selling price per unit. For example, if a business sells 100 units of a product at $50 per unit, the sales revenue would be $5,000.
Tracking sales revenue over time helps businesses identify trends and evaluate the effectiveness of their sales strategies. For instance, if sales revenue is declining, management can analyze the data to identify potential causes and take corrective actions to address the underlying issues.
By monitoring sales revenue as a KPI, businesses can ensure they are on track to achieve their revenue targets and make informed decisions to optimize their sales performance.
3. Customer lifetime value (CLV) - Marketing KPI
Customer lifetime value (CLV) is a sales KPI that measures the total value a customer brings to a business over the course of their relationship. This metric helps businesses understand the long-term value of their customers and the potential ROI of their marketing and sales efforts.
To calculate CLV, a company multiplies the average value of a purchase by the number of purchases made per year and the average duration of the customer relationship. For example, if a customer makes three purchases per year with an average purchase value of $50 and the average duration of the customer relationship is five years, the CLV would be $750.
By tracking CLV as a KPI, businesses can focus on building long-term relationships with their customers, increasing customer loyalty, and optimizing their sales strategies to maximize their revenue and profitability.
Related article : Customer Service KPI: 20 Metrics To Measure Team Performance – Meaning, Examples, Templates, and Dashboard
4. Average purchase value - Marketing KPI
Average purchase value is a sales KPI that measures the average amount of money a customer spends per transaction. It is a vital metric for businesses to understand the purchasing habits of their customers and to identify opportunities to increase revenue.
To calculate the average purchase value, businesses divide the total revenue generated from sales by the number of transactions during a given period. For example, if a business generated $10,000 in sales revenue from 500 transactions during a month, the average purchase value would be $20 ($10,000 / 500).
Tracking average purchase value over time can provide valuable insights into customer behavior and inform sales and marketing strategies. For instance, if the average purchase value has been declining, it may suggest that customers are spending less per transaction, indicating a need to revisit pricing strategies or offer incentives to encourage customers to spend more.
Average purchase value is particularly essential for businesses with a high volume of transactions, such as e-commerce stores. By understanding the average purchase value, businesses can identify opportunities to optimize their pricing strategies, bundling options, and discounts to encourage customers to spend more per transaction.
Related article : How To Create A Marketing KPI Dashboard
5. Conversion rate - Marketing KPI
Conversion rate is a sales KPI that measures the percentage of website visitors who take a desired action, such as making a purchase or filling out a form. This metric helps businesses understand the effectiveness of their website and marketing campaigns in driving conversions and generating revenue.
To calculate conversion rate, a company divides the number of website visitors who took a desired action by the total number of website visitors. For example, if a website had 1,000 visitors and 50 of them made a purchase, the conversion rate would be 5%.
By tracking conversion rate as a KPI, businesses can identify opportunities to improve their website and marketing strategies to increase conversions, such as optimizing their website design, improving their messaging, or targeting their audience more effectively.
Relate article: KPI for Finance Department: 26 Essential Metrics to Monitor for Finance Manager with Examples
Marketing KPI

6. Cost per acquisition (CPA)
Cost per acquisition (CPA) is a crucial marketing metrics that measures the amount of money a business spends to acquire a new customer. It helps to determine the effectiveness of marketing campaigns in generating new business. CPA can be calculated by dividing the total cost of the marketing campaign by the number of new customers acquired during that campaign.
For example, if a business spends $1000 on a marketing campaign and acquires 100 new customers, the CPA would be $10. This means that it cost $10 to acquire each new customer during that campaign.
CPA is an important metric because it allows businesses to evaluate the profitability of their marketing efforts. By calculating the CPA for each campaign, businesses can compare the cost of acquiring new customers to the revenue generated by those customers. This helps businesses to make data-driven decisions about where to allocate their marketing budget and which campaigns to prioritize.
Related article : Why KPIs Are Important: 10 Reason Key Performance Indicators Stands For? -Meaning, Examples ,Template
7. Return on investment (ROI)
Return on investment (ROI) is a marketing metrics that measures the amount of revenue generated by a marketing campaign compared to the amount of money spent on that campaign. ROI is expressed as a percentage and is calculated by dividing the revenue generated by the cost of the campaign and multiplying the result by 100.
For example, if a business spends $1000 on a marketing campaign and generates $5000 in revenue, the ROI would be 400%. This means that for every dollar spent on the campaign, the business earned $4 in revenue.
ROI is an important metric because it allows businesses to evaluate the effectiveness of their marketing campaigns in generating revenue. By tracking the ROI for each campaign, businesses can identify which campaigns are generating the highest return on investment and adjust their marketing strategy accordingly.
In addition, ROI can also help businesses to make informed decisions about where to allocate their marketing budget. For instance, if a particular campaign is generating a high ROI, the business may choose to allocate more funds towards that campaign or similar campaigns in the future. On the other hand, if a campaign is not generating a positive ROI, the business may choose to re-evaluate the campaign or allocate less funds towards it in the future.
8. Click-through rate (CTR)
Click-through rate (CTR) is a marketing metrics that measures the percentage of people who click on an ad or link out of the total number of people who view it. CTR is a crucial metric for measuring the success of digital advertising campaigns, such as pay-per-click (PPC) advertising or email marketing.
To calculate CTR, divide the number of clicks an ad or link receives by the number of impressions (or views) it receives, and then multiply the result by 100 to get a percentage. For example, if an ad receives 1000 views and 100 people click on it, the CTR would be 10% (100/1000 x 100).
CTR is important because it indicates how effective an ad or link is in engaging and attracting potential customers. A high CTR means that the ad or link is resonating with the audience, leading to more clicks and potential conversions. A low CTR, on the other hand, suggests that the ad or link is not relevant or compelling enough to encourage clicks.
By monitoring CTR, businesses can identify which ads or links are performing well and which ones need improvement. They can also use CTR to optimize their ad targeting, messaging, and placement to improve their overall digital marketing performance.
Related article : KPI Scorecards : Track Your Business Performance – Meaning , Template ,Dashboards , Examples
9. Cost per click (CPC)
Cost per click (CPC) is a marketing key performance indicator that measures the amount of money it costs to get a single click on an ad or link. CPC is commonly used in pay-per-click (PPC) advertising, where businesses pay each time someone clicks on their ad. CPC is calculated by dividing the total cost of the ad campaign by the total number of clicks it receives. For example, if a business spends $500 on a PPC campaign and gets 100 clicks, the CPC would be $5 ($500 / 100 clicks).
CPC is an important metric for businesses to monitor because it helps them understand how much they are paying for each click and whether their ads are cost-effective. A high CPC could indicate that the ad is not targeting the right audience or that the ad messaging or creative is not engaging enough to drive clicks. A low CPC, on the other hand, suggests that the ad is performing well and generating clicks at a reasonable cost.
By tracking CPC, businesses can optimize their PPC campaigns to improve their ad targeting, messaging, and placement. This can help them drive more clicks and conversions while minimizing their ad spend.
10. Cost per lead (CPL)
Cost per lead (CPL) is a marketing metrics that measures the amount of money it costs to generate a single lead. A lead is someone who has shown interest in a business’s product or service and provided their contact information, such as their email address, phone number, or social media handle. CPL is calculated by dividing the total cost of the marketing campaign by the total number of leads generated.For example, if a business spends $1,000 on a social media ad campaign and generates 100 leads, the CPL would be $10 ($1,000 / 100 leads).
CPL is an important metric for businesses to monitor because it helps them understand how much they are paying for each potential customer. A high CPL could indicate that the marketing campaign is not targeting the right audience or that the messaging is not resonating with potential customers. A low CPL, on the other hand, suggests that the marketing campaign is effective at generating leads and driving interest in the business’s product or service.
By tracking CPL, businesses can optimize their marketing campaigns to improve their lead generation and conversion rates. This can help them generate more leads and customers while minimizing their marketing spend.

Website KPIs

11. Unique visitors - Marketing KPI
Unique visitors refer to the number of distinct individuals who visit a website within a specific time frame. A unique visitor is identified by their IP address or unique cookie, which is a small file stored on the user’s device that tracks their browsing behavior. This metric is useful in understanding the size of a website’s audience and the level of interest in its content. However, it does not indicate the frequency of visits or the actions taken on the website. For example, a single user may visit a website multiple times and be counted as a unique visitor each time. Therefore, unique visitors are typically used in conjunction with other website KPIs to provide a more comprehensive understanding of website performance.
Related article : IT KPI : 25 Key Performance Indicator for IT Managers – Meaning ,Dashboard and Examples
12. Pageviews - Marketing KPI
Pageviews are a website KPI that measures the total number of pages viewed by users during a specified time period. A pageview is recorded when a user accesses a web page on a website. This metric is useful in determining how engaged users are with a website and its content. It can also help to identify popular pages and areas of the website that may require improvement. However, it is important to note that pageviews do not measure unique visitors or the level of engagement on a particular page. For example, a user may visit a page multiple times, and each visit will be counted as a separate pageview. Therefore, pageviews are typically used in conjunction with other website KPIs to provide a more complete picture of website performance.
13. Bounce rate -Marketing KPI
Bounce rate is a website KPI that measures the percentage of visitors who leave a website after only viewing one page, without taking any further action. A high bounce rate can indicate that visitors aren’t finding the information they need or that the website is difficult to navigate. A low bounce rate, on the other hand, indicates that visitors are engaging with the website and finding what they need.
It’s important to note that a high bounce rate isn’t always a bad thing. For example, a landing page designed to get visitors to fill out a form or make a purchase may have a high bounce rate if visitors complete the desired action before viewing any other pages. Similarly, a blog post that fully answers a visitor’s question may have a high bounce rate if the visitor leaves satisfied with the information they found.
Overall, understanding the bounce rate of a website is important in identifying areas of the website that may need improvement, and in measuring the effectiveness of website content and design.
Related article : Top 11 Important Training KPIs HR Managers Should Have
14. Time on site - Marketing KPI
Time on site is a website KPI that measures the average amount of time a visitor spends on a website. It is a critical metric for understanding user engagement and the effectiveness of a website’s content and design. A high time on site typically indicates that users are finding the website useful, engaging, and informative, whereas a low time on site may indicate that visitors are not finding what they need or are having difficulty navigating the site.
Time on site can be measured for individual pages, sections of a website, or for the entire site. It can also be broken down by traffic source, such as search engine, social media, or referral traffic. By analyzing time on site data, website owners and marketers can gain insights into how users are interacting with the website and identify areas where improvements can be made. For example, if time on site is low for a particular page, it may indicate that the page is not providing enough value to users and needs to be updated or optimized.
15. Exit rate - Marketing KPI
Exit rate is a website KPI that measures the percentage of visitors who leave a website after viewing multiple pages. This metric is different from bounce rate, which measures the percentage of visitors who leave a website after only viewing one page.
Exit rate is calculated by dividing the total number of exits from a page by the total number of pageviews. This KPI can be useful in identifying pages on a website that have high exit rates, which may indicate issues with content or user experience.
For example, a high exit rate on a product page may indicate that visitors are not finding the information they need or are encountering issues with the checkout process. By identifying and addressing these issues, businesses can work to improve the user experience and decrease the exit rate, ultimately leading to increased engagement and conversions on the website.

Social Media KPIs

16. Followers - Marketing KPI
Followers is a social media KPI that refers to the number of people who have chosen to subscribe to a particular social media account, such as on Twitter, Instagram, Facebook, LinkedIn, etc. These individuals are interested in the content that the account shares and have given permission to the business to appear in their social media feeds. The more followers a business has, the larger its potential audience and reach, which can lead to increased brand awareness, engagement, and ultimately, sales. However, it’s important to note that the number of followers alone is not the only measure of success on social media, as engagement and conversions also play an important role in determining the effectiveness of social media marketing efforts.
Related article : Social Media KPIs for Managers : 25 Metrics You Should Be Tracking for Your Marketing Strategy
17. Engagement rate - Marketing KPI
Engagement rate is a social media KPI that measures the level of interaction between a brand and its social media audience. It is calculated by dividing the total number of engagements (likes, comments, shares, etc.) on a social media post by the total number of followers and multiplying it by 100.
The engagement rate is a useful metric to determine the effectiveness of a brand’s social media strategy. A high engagement rate indicates that the brand’s content is resonating with its audience and generating interest, while a low engagement rate suggests that the content is not engaging enough or may not be reaching the intended audience.
In addition, a high engagement rate can lead to increased visibility and reach on social media, as the platform’s algorithm may prioritize content with high engagement to be shown to a wider audience. Therefore, it is essential for brands to monitor their engagement rate and adjust their social media strategy accordingly to increase audience engagement and drive business growth.
18. Impressions - Marketing KPI
Impressions in social media refer to the number of times a post, ad, or content is displayed to a user’s screen. This means that if a post or ad is shown on a user’s screen multiple times, each display counts as a separate impression. Impressions are important for businesses to measure because they help to gauge the visibility and reach of their social media content. By tracking impressions, businesses can determine which posts or ads are receiving the most views and adjust their social media strategy accordingly. Additionally, impressions can be useful in determining the ROI of social media advertising campaigns and identifying which platforms and targeting options are most effective.
Related article : KPI In Project Management : KPIs In Agile For Planning Project Management – A Consultant’s Guide With Examples
19. Reach - Marketing KPI
Reach is a social media KPI that refers to the number of unique individuals who have viewed a particular post or ad. It measures the total number of people who have seen the content, regardless of whether they have engaged with it.
Reach is an essential metric because it provides insight into how well a business is expanding its audience and increasing its brand visibility. A high reach indicates that the content is gaining more visibility, and more people are becoming aware of the brand.
Social media platforms often display reach as a graph, showing how many people viewed the content over a given time period. Reach can be measured for both organic and paid content, and it can be broken down by various demographic and geographic factors. By analyzing reach, businesses can determine which types of content and targeting strategies are most effective in expanding their audience and increasing their brand awareness.
20. Social media referral traffic - Marketing KPI
Social media referral traffic is a social media KPI that measures the number of visitors who come to a website from social media platforms. When social media users click on a link to a website from a social media post, it is counted as social media referral traffic.
By tracking social media referral traffic, businesses can determine the effectiveness of their social media strategy in driving traffic to their website. This KPI can also help businesses understand which social media platforms are driving the most traffic to their site and which social media content is most effective in driving traffic.
To track social media referral traffic, businesses can use website analytics tools like Google Analytics. By setting up tracking parameters and tracking the source of website traffic, businesses can determine which social media platforms are driving the most traffic to their site and which social media content is most effective in driving traffic.

Email Marketing KPI

21. Open rate - Marketing KPI
Open rate is an email marketing metrics that measures the percentage of subscribers who opened a particular email. It is calculated by dividing the number of unique opens by the number of delivered emails, then multiplying the result by 100.
A high open rate indicates that the subject line and content of the email resonated with the recipients, encouraging them to open it. However, it’s important to note that open rates can be impacted by various factors, including the sender reputation, the quality of the subject line, the time and day the email was sent, and the relevance of the content to the audience.
Email marketers often use open rates to evaluate the effectiveness of their email campaigns and to optimize future campaigns. By analyzing the open rates of different emails and comparing them, marketers can identify what type of subject lines, content, and offers are most effective in engaging their subscribers
Related article : Top 20 HR KPI Metrics & Examples for Human Resource Manager, Executive, Department – HRMS
22. Click-through rate - Marketing KPI
Click-through rate (CTR) is a metric used in email marketing to measure the effectiveness of an email campaign by tracking the percentage of people who click on a link within an email. It is calculated by dividing the number of unique clicks by the number of delivered emails, and then multiplying by 100 to get a percentage.
A high CTR indicates that the email was engaging and relevant to the recipient, leading them to take action and click through to the desired landing page or website. A low CTR, on the other hand, suggests that the email failed to capture the recipient’s attention or failed to provide value, resulting in less engagement and fewer clicks.
To improve CTR, email marketers may test different subject lines, personalization techniques, and content to determine what resonates best with their audience. They may also optimize the email design for mobile devices, as more and more people are accessing their email on mobile devices. Additionally, clear and prominent calls-to-action can encourage recipients to click through and take the desired action.
23. Conversion rate - Marketing KPI
Conversion rate is a key email marketing key performance indicator that measures the percentage of recipients who take the desired action after clicking on a link in an email. This desired action could be anything from making a purchase, filling out a form, subscribing to a service, or any other action that aligns with the business’s email marketing goals.
The conversion rate is calculated by dividing the number of people who complete the desired action by the total number of people who clicked on the link in the email, and then multiplying that by 100 to get a percentage. For example, if 1,000 people clicked on a link in an email, and 100 of them made a purchase, the conversion rate would be 10% (100/1,000 x 100).
The conversion rate is an important metric because it measures the effectiveness of the email campaign in driving desired actions. A high conversion rate indicates that the email campaign is successfully engaging recipients and driving them to take action, while a low conversion rate suggests that improvements could be made to the email content, design, or call-to-action to encourage more conversions.
By tracking the conversion rate over time, businesses can identify trends and make adjustments to their email marketing strategy to improve overall performance and drive more conversions.
24. Unsubscribe rate - Marketing KPI
Unsubscribe rate is a key performance indicator in email marketing that measures the percentage of subscribers who opt-out or unsubscribe from an email list after receiving an email campaign. It indicates the level of disengagement or dissatisfaction of subscribers with the content or frequency of emails they receive.
A high unsubscribe rate can be an indication of poor email content, irrelevant or excessive frequency, poor segmentation, or a mismatch between the subscribers’ expectations and the actual content. A low unsubscribe rate, on the other hand, indicates that the subscribers are engaged and satisfied with the content and frequency of emails they receive.
It is important to monitor the unsubscribe rate regularly to ensure that it stays within a reasonable range and to take corrective measures if it starts to increase. This can include optimizing the email content, segmenting the email list, improving the email frequency, or providing more options for subscribers to manage their preferences.
25. List growth rate - Marketing KPI
List growth rate is a key performance indicator (KPI) used in email marketing to measure the rate at which a business is growing its email list. It is calculated by comparing the number of new email subscribers gained during a specific period (such as a week or a month) to the total number of email subscribers at the beginning of that period.
For example, if a business has 1,000 email subscribers at the beginning of the month and gains 200 new subscribers during that month, the list growth rate for that month would be 20% ((200/1,000) x 100).
A high list growth rate indicates that a business is successfully attracting new subscribers and expanding its email audience, which can lead to increased engagement, sales, and revenue. On the other hand, a low list growth rate may suggest that a business needs to re-evaluate its email marketing strategy and consider ways to increase subscriber acquisition, such as offering incentives or improving the visibility of its opt-in forms.
Related article : Practical KPI Examples

Importance of KPI Performance Management in Sales and Marketing
DoerHRM– KPI performance management is a critical element for the success of any sales and marketing department. By monitoring and measuring key performance indicators, organizations can optimize their marketing campaigns, improve sales performance, and ultimately drive business growth.
In today’s digital age, the importance of KPI performance management has become even more evident. With the rise of data analytics and marketing automation tools, businesses can easily track their marketing metrics and gain insights into their performance.
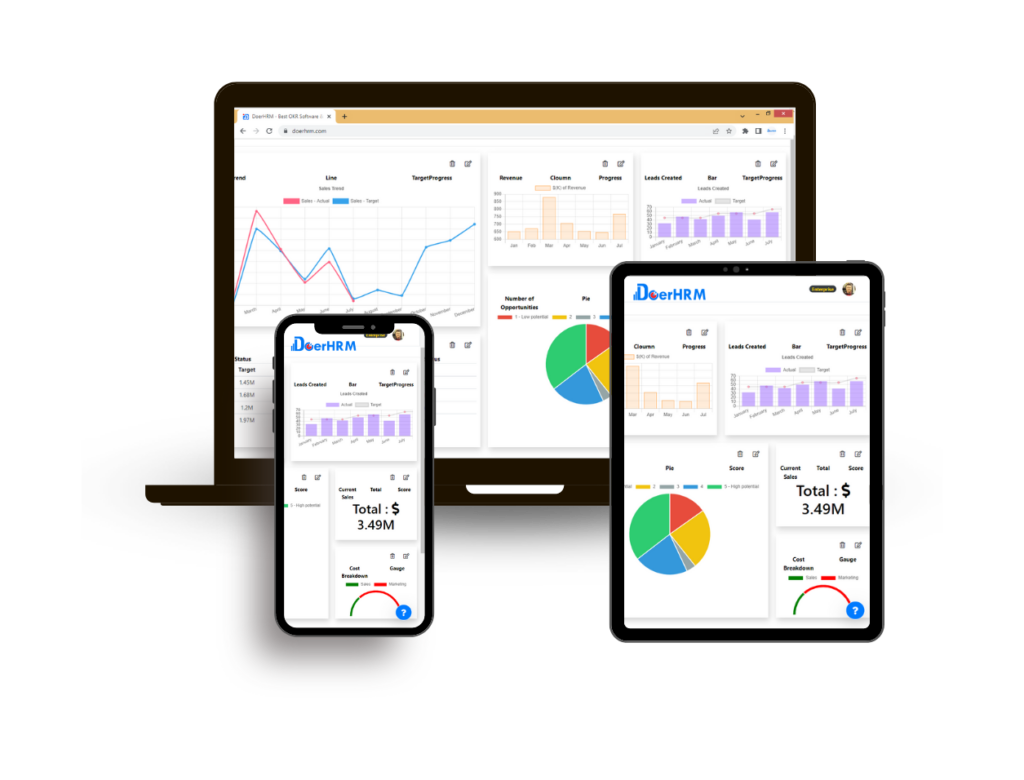
One such tool that has been gaining popularity in recent years is DoerHRM. DoerHRM is a comprehensive performance management software that helps businesses track their KPIs and improve their sales and marketing performance.
With DoerHRM, businesses can easily monitor and measure their KPIs, including revenue growth rate, sales revenue, customer lifetime value, conversion rate, cost per acquisition, and more. By having access to real-time data, sales and marketing managers can make data-driven decisions, adjust their campaigns as needed, and ultimately improve their ROI.
DoerHRM also offers advanced reporting and analytics capabilities, allowing businesses to gain deeper insights into their performance and identify areas for improvement. With customizable dashboards and visualizations, sales and marketing teams can easily track their progress towards their goals and communicate their performance to key stakeholders.
Overall, the importance of KPI performance management in sales and marketing cannot be overstated. By leveraging tools like DoerHRM, businesses can optimize their marketing efforts, improve sales performance, and drive long-term growth.
Key Insights 25 Digital Marketing KPI
In conclusion, tracking marketing key performance indicator is crucial for businesses to evaluate the success of their marketing efforts and make informed decisions to improve their strategies. By monitoring sales KPIs such as revenue growth rate, sales revenue, customer lifetime value, and average purchase value, companies can gain insights into their customers’ behavior and preferences and adjust their sales tactics accordingly.
Conversion rate, cost per acquisition, and return on investment are important metrics that help measure the effectiveness of marketing campaigns. A high conversion rate means that a significant number of website visitors take the desired action, such as making a purchase or signing up for a newsletter. Cost per acquisition and return on investment help companies to determine whether their marketing investment is generating a positive return.
Click-through rate and cost per click are essential for measuring the performance of online advertising campaigns. A high click-through rate indicates that the ad is relevant to the target audience, while a low cost per click suggests that the company is getting good value for its ad spend.
Unique visitors, pageviews, bounce rate, time on site, and exit rate are essential website KPIs that help measure the effectiveness of a company’s website in attracting and retaining visitors. A high bounce rate or exit rate can suggest that visitors are not finding what they are looking for or that the website’s user experience needs improvement.
Social media KPIs such as followers, engagement rate, impressions, reach, and social media referral traffic help measure the effectiveness of social media campaigns. A high engagement rate and social media referral traffic suggest that the company’s social media content is resonating with its audience, while a high number of impressions and reach indicate that the content is being seen by a large number of people.
Finally, email marketing key performance indicator such as open rate, click-through rate, conversion rate, unsubscribe rate, and list growth rate help measure the effectiveness of email marketing campaigns. A high open rate and click-through rate suggest that the email content is relevant and engaging, while a high conversion rate indicates that the email is driving desired actions, such as purchases or sign-ups. A low unsubscribe rate and high list growth rate suggest that the email list is healthy and growing.
Overall, by tracking these marketing metrics, businesses can gain insights into their marketing performance, optimize their strategies, and drive business growth