
THE EXECUTIVE COMMAND CENTRE
One Scorecard. One Dashboard. The Whole Business, on One Screen.
DoerHRM’s Balanced Scorecard cascades strategy from boardroom objective to ground-level initiative — and every one of those live numbers rolls straight up into a real-time CEO Dashboard, so leadership always knows exactly where the business stands.
Trusted by 100+ Organizations for KPI, HR, and Performance Management
DoerHRM supports organizations with KPI software, HR solutions, performance management, KPI training, coaching, and practical business improvement programs.







Four Balanced Perspectives
Balance all four perspectives,
not just the financials.
Stop measuring financials in isolation. DoerHRM BSC forces balance across money, customers, process, and people — the same four perspectives that feed every widget on the CEO Dashboard.
Financial
Revenue growth, cost control, budget performance, and cash flow — measured against targets that matter to your CFO and board.
- Revenue Growth & Gross Margin %
- Budget Performance vs Plan
- Predictive Budget Forecast
Customer
Customer satisfaction, service quality, retention rate, and stakeholder trust — the metrics that determine long-term loyalty and reputation.
- Customer Satisfaction Score (CSAT)
- Net Promoter Score (NPS)
- Customer Retention & Repeat Rate
Internal Process
Operational efficiency, process cycle time, quality compliance, and risk management — everything that drives how well the business executes.
- Schedule Adherence
- Process Quality & Compliance Rate
- Procurement & Operational Savings %
Learning & Growth
Talent retention, leadership pipeline, workforce capability, training completion, and digital adoption — the foundation all other perspectives rest on.
- Employee Retention & Turnover Rate
- Training & Certification Completion
- Digital Adoption & Capability Score
Full Strategic Alignment
Align every KPI to a
strategic objective.
DoerHRM cascades a strict hierarchy — from strategic objective down to the KPI and the initiative delivering it, with full traceability. Nothing floats free, nothing is unaccountable, and nothing reaches the CEO Dashboard without a named owner behind it.
1
Perspective — The "Why"
Every objective has to earn its place under Financial, Customer, Internal Process, or Learning & Growth — so nothing gets funded just because a department wanted it.
2
Objective — The Goal
What the business actually wants — from Protect Profit Margins to Expand Market Share — stated once, at the top, so nobody downstream is guessing.
3
Key Result Area — The Focus
The lane that closes the gap between “we want this” and “someone owns getting there” — e.g. Cost Budget Control or Workforce Capability Development.
4
KPI — The Number
A number that can’t hide behind a status meeting — colour-coded health and a named owner, every time.
5
Initiative — The Action Plan
The actual work moving the KPI — with an owner and a deadline, so “in progress” can never quietly mean “forgotten”.
Multiple Views, One Source of Truth
Same scorecard.
However you need to see it.
Switch between views in one click — no re-entry, no duplication. Two more views — Strategy Map & Strategy Roadmap — live on their own page.
Scorecard
Gantt Chart
Tree
List
Map
The CEO Dashboard
The screen leadership opens Monday morning.
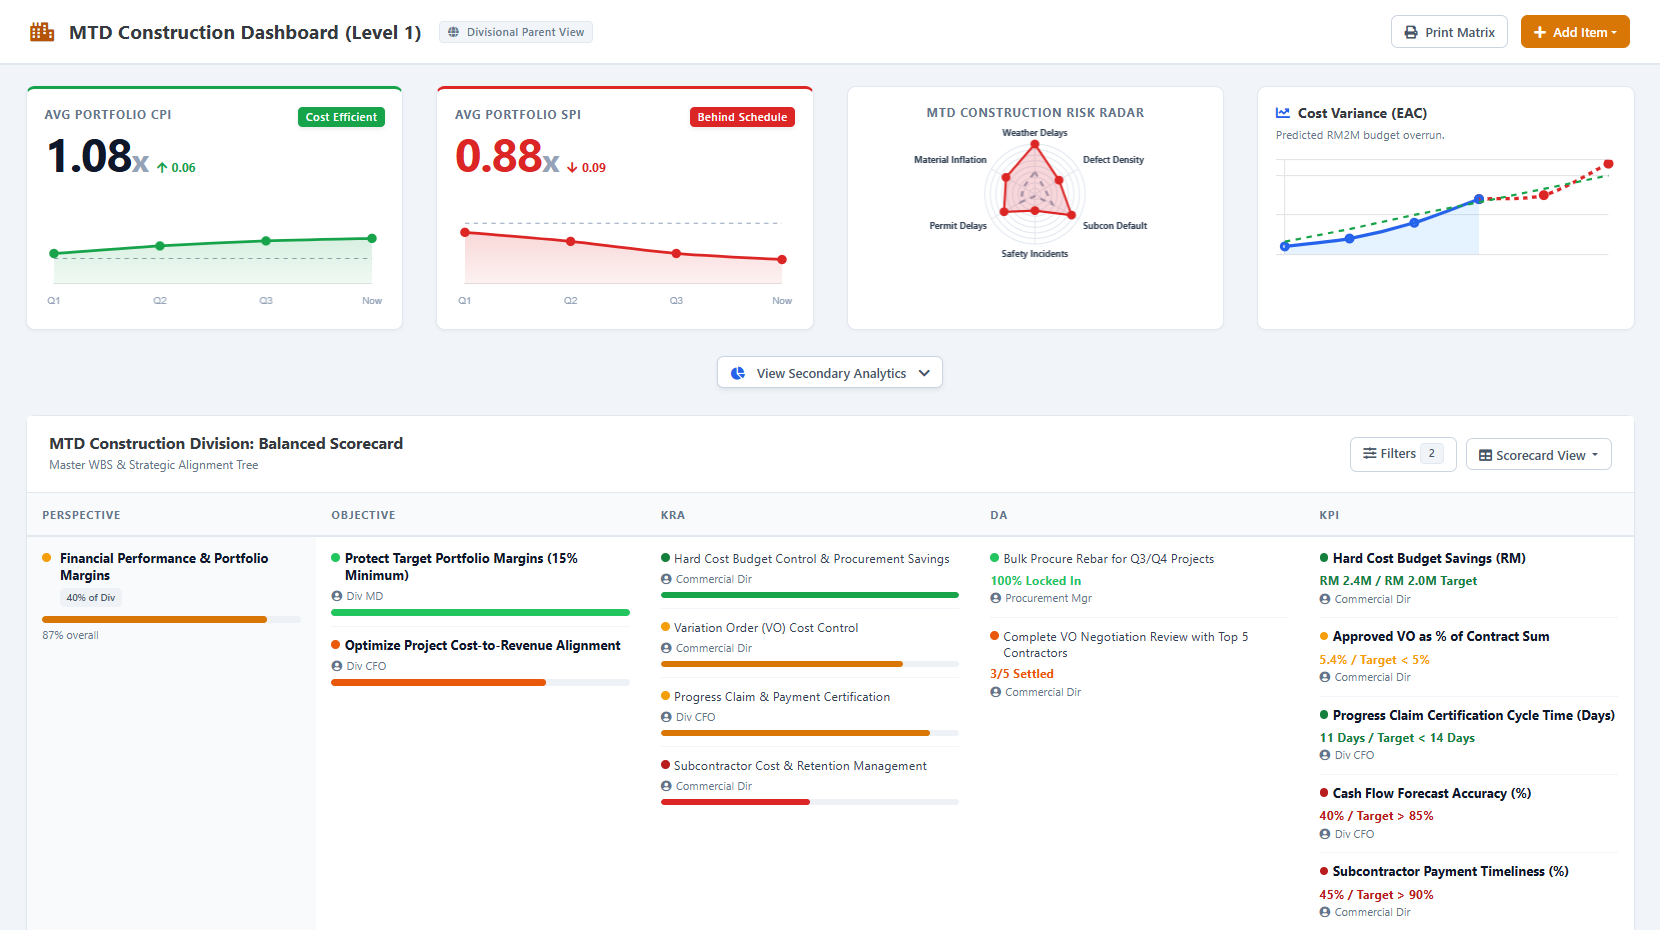
Every Perspective, Objective, KRA, KPI and Initiative rolls up into one executive view — so a CEO can see the health of the entire portfolio, and click straight into the exact KPI causing a problem, without waiting for a status meeting.
Budget Performance
Track whether initiatives are running over or under budget — updated live as costs and progress are logged across all units.
Schedule Adherence
See whether delivery is ahead or behind schedule at a glance — so leaders can intervene before a delay becomes a crisis.
Risk Radar
A radar chart consolidates risk signals across multiple strategic dimensions — giving leadership a full risk picture in a single visual.
Predictive Budget Forecast
Predictive forecasting shows where budget overruns are forming — weeks before they materialise on the P&L.
Everything You Need
Balanced Scorecard Software built for how modern organisations actually work
Four Key Perspectives
Balanced focus across Financial, Customer, Internal Process, and Growth pillars. Ensures you measure what matters.
Multi-tier Cascading
Group, Division, Department, and Staff alignment in one unified dashboard. Inherit metrics and roll up progress.
Executive Command Centre
One screen for leadership: portfolio health, budget, schedule and risk — no digging through individual scorecards to find it.
Predictive Risk Radar
Instant alerts when schedule or budget variances threaten your strategic targets.
Build & Manage In-Browser
Create and edit Perspectives, Objectives, KRAs, KPIs, and Initiatives right in the browser — no spreadsheets, no rebuilds. Your scorecard stays live and editable.
Filter & Drill Down
Filter the scorecard by level, perspective, status, or theme — then click any item to drill into its full detail in a focused modal.
Frequently Asked Questions
Questions about BSC & the CEO Dashboard
The Balanced Scorecard is the full strategy tree — every Perspective, Objective, KRA, KPI and Initiative with its owner and status. The CEO Dashboard is the executive summary layer built on that same data: portfolio-wide budget performance, schedule adherence, a risk radar, and a predictive budget forecast, all on one screen.
It cascades strategy through five levels: Perspective, Objective, Key Result Area, KPI, then Initiative. Each item carries an owner, a weightage and a RAG status, so progress rolls up automatically from ground-level work to boardroom objectives — the same roll-up that powers the CEO Dashboard.
The four perspectives are Financial, Customer, Internal Process, and Learning & Growth. DoerHRM measures all four together so no single dimension is optimised in isolation.
Four live executive widgets: overall Budget Performance, overall Schedule Adherence, a Risk Radar consolidating exposure across multiple strategic dimensions, and a Predictive Budget Forecast that projects overruns before they happen.
Yes. DoerHRM serves Malaysian SMEs and multi-division enterprises alike — SMEs start fast without heavy setup, while enterprises cascade KPIs across Group, Division, Department and Staff levels.
Yes. DoerHRM is free for up to 3 users and includes a 14-day full-feature trial with no credit card required.
Your next performance risk is already
forming right now.
See it before it reaches your leadership table. Get a live walkthrough of the DoerHRM Balanced Scorecard and CEO Dashboard on your own strategic objectives.