Every organisation has specific metrics they need to track, from business-wide goals to long-term goals. A KPI dashboard is a good way to show how these insights can be used.
KPI dashboards are a great way for executives to improve how they manage strategic goals and stay on top of changes, problems, and trends in performance at a high level. When used correctly with other modern analytics tools, KPI dashboards can be very useful.
Why do we use KPI dashboards?
To put it simply, they are one of the easiest ways to track progress toward goals.
A KPI dashboard is basically a top-level graphical summary of core business goals or more specific outcomes like departmental targets. It can be used and referred to at-a-glance to more efficiently track general progress toward set goals, analyse possible trends, and make more data-driven decisions in general.
With charts and tables to back up the numbers, KPI dashboards also let users compare and understand what the numbers mean. Many line-of-business users may not be able to easily get insights from spreadsheet metrics alone. Interactive data visualisation opens up new ways to evaluate the overall performance of an organisation.
The most important thing is that they give helpful big-picture information about performance, not every single detail. They don’t give the user all the answers, but they do help them figure out which parts of the business may need more or deeper analysis.
What are included in KPI dashboards?
Conversion rate, revenue growth, churn rate, budget threshold, net profit, etc. are just some of the key performance indicators (KPIs) that may be shown in a modern key performance indicator (KPI) dashboard.
The most effective tools let you create individualised dashboards for each user, such as a department head or an account manager, with the most relevant key performance indicators (KPIs) prominently displayed.
The best thing about a modern business dashboard is that it can show information about a company’s performance in real-time. So, business leaders and project teams can make decisions based on real data instead of a gut feeling that might or might not be right.
Also, a KPI dashboard that is up-to-date and well-designed makes it easy to see where problems are and fix them right away. Managers who use KPI dashboards every day to get a quick overview know where to put their efforts and if they need to fix any processes that aren’t working well.
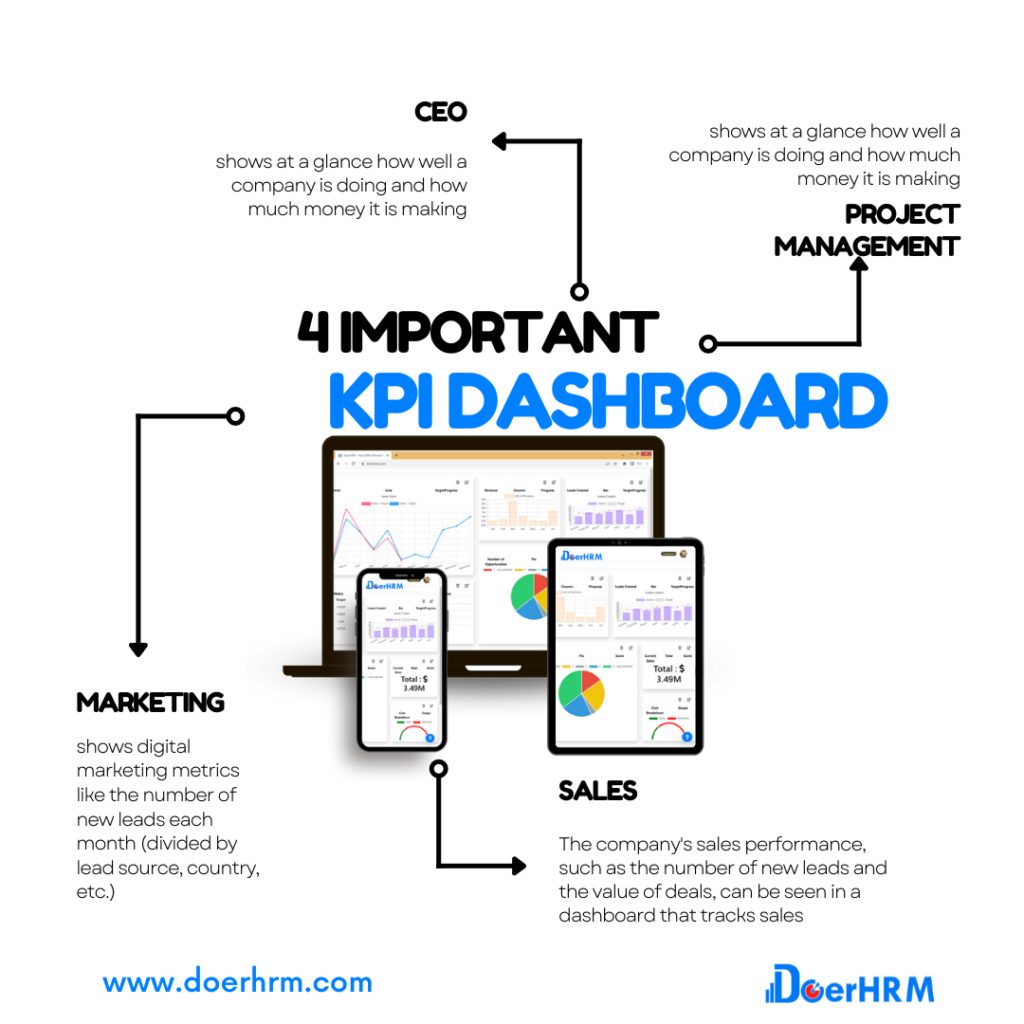
The KPIs on a dashboard are chosen and put together based on the needs of the company. Here are 4 important KPI dashboards in a company:
CEO KPI dashboard
The CEO dashboard shows at a glance how well a company is doing and how much money it is making. It has a lot of sensitive information on it, so only the CEO and other high-level executives can use it. The executive dashboard is also used to keep track of how well the business is doing and where the problems are.
Both the CEO dashboard and the company dashboard have KPIs that show how well the business is doing. In management meetings, company dashboards can be used to get a quick look at how the business is doing.
For a quick lesson, see the list of top 5 KPIs that you will see in a CEO dashboard
Project management KPI dashboard
The project team dashboard shows how well the people working on the same project are doing and gives a quick summary of how the project is going. Keeping everyone up to date on project progress and goals is a great idea. With their dashboard, project managers can see where they aren’t meeting their goals and keep an eye on the project budget.
On a project dashboard, the KPIs include the planned budget, the time spent on specific tasks, the return on investment (ROI) of projects and tasks, the performance of team members, the activities that have been completed, and the time left until the project is done.
Sales KPI dashboard
The company’s sales performance, such as the number of new leads and the value of deals, can be seen in a dashboard that tracks sales. Sales managers can see right away which salespeople do the best job and how much money they can expect to make from new deals. Also, a sales dashboard makes it easy to see when sales start to slow down, which gives you time to do something about it, like start a marketing campaign or motivate salespeople.
On the sales dashboard, the key performance indicators (KPIs) include the number of new customers and leads, the rate of customers leaving, the value of new deals, revenue goals, a comparison to previous periods, and the performance of salespeople.
Marketing KPI dashboard
The marketing dashboard shows digital marketing metrics like the number of new leads each month (divided by lead source, country, etc.), how much money was spent on different marketing channels, and how well email campaigns did. A well-made marketing dashboard lets you see at a glance how well the marketing team is doing.
Other metrics on a marketing dashboard include cost-per-lead, cost-per-customer, lead-to-customer conversion rate, SEO metrics, website traffic, and many more.
KPI dashboards provide a number of key benefits for businesses
Today’s users have access to sophisticated data analysis tools, such as automated company monitoring, embedded analytics, and natural language processing. However, for operational use cases, a unified KPI dashboard is still an excellent tool for quickly answering high-level performance queries.
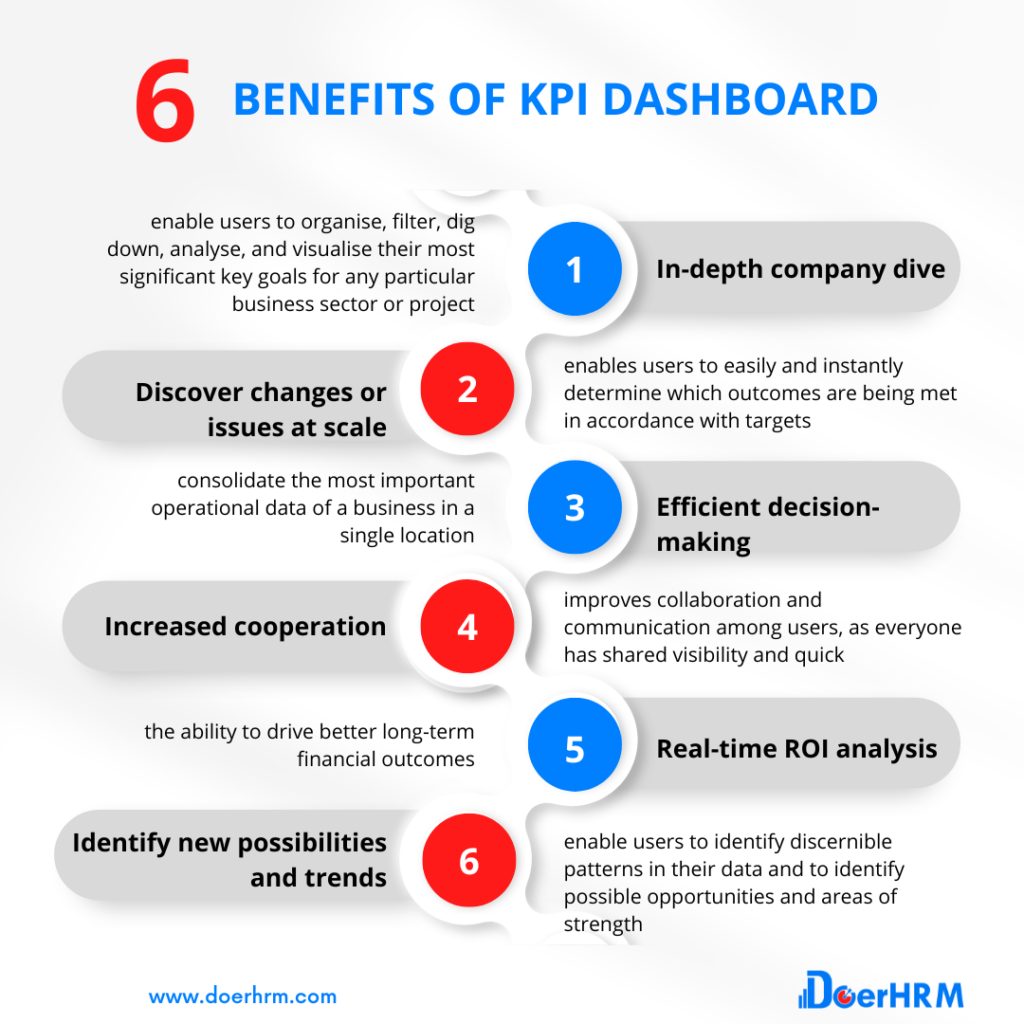
Here, we list six of the most essential benefits KPI dashboards may provide when utilised properly:
In-depth company dive
KPI dashboards enable users to organise, filter, dig down, analyse, and visualise their most significant key goals for any particular business sector or project in a highly interactive manner, which often helps transform big, complicated data into an easy-to-understand format.
Discover changes or issues at scale
Whether they are segmented by department, overarching objectives, or high-level targets, having an organised dashboard that displays critical KPIs next to each other enables users to easily and instantly determine which outcomes are being met in accordance with targets, and what may require priority or detailed examination for effective corrective action.
Efficient decision-making
KPI dashboards consolidate the most important operational data of a business in a single location, thereby assisting in eliminating data silos, increasing the visibility of KPI reporting, and enhancing the efficiency of analysing performance, setting objectives, allocating investment, and improving user workflows.
Increased cooperation
Having a high-level visual overview of progress toward KPIs improves collaboration and communication among users, as everyone has shared visibility and quick, easy access to the same dashboards to discuss performance and where the team can work together to improve it.
Real-time ROI analysis
With the ability to monitor and analyse the organization’s most important performance metrics in real-time, users can determine which decisions and investments have been successful and by how much, allowing for more proactive analysis and the ability to drive better long-term financial outcomes.
Identify new possibilities and trends
KPI dashboards enable users to identify discernible patterns in their data and to identify possible opportunities and areas of strength (or underperformance) in order to set or adjust their goals and improve the business’s overall performance.
Conclusion
You should now have a good idea of what a KPI dashboard is for and what it can do. By putting together multiple dashboards with relevant information, companies can start to use reporting that is both complete and useful. Make sure to check your dashboards often to see if all the metrics are still useful and if the data is being updated in real-time.