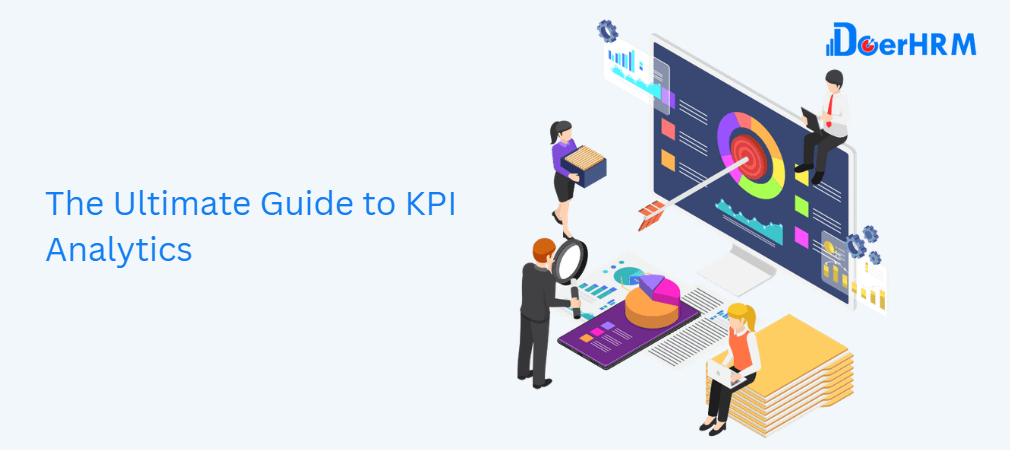
This guide will explain what KPI Analytics is and how you can use it to look at both Key Performance Indicators (KPIs) and the metrics that go along with them. We’ll explain about why companies do KPI analysis and what benefits it brings. We’ll also discuss about the most effective KPI analysis strategies and how to use them in your company.
What does KPI Analytics mean?
The process of analysing Key Performance Indicators (KPIs), including the data and metrics used in KPI formulas, is called KPI Analytics. When these metrics are analysed, they explain differences in graphs and charts that are usually used to show KPIs. Senior managers and data analysts use KPI analytics to learn more about processes, make them more efficient, and find new opportunities.
KPI analytics is an important part of keeping an eye on the health of a business or project, and it was mostly used to find out why things went wrong. But now, businesses use KPI analysis to make better products for their customers, reduce risk, and make more money. When done right, analysis can help you make much better decisions than KPIs alone.
Why do businesses analyze KPIs?
Companies do much better than their competitors when they use KPIs and look at the data. In particular, businesses use KPI Analytics with three main goals in mind:
- To find new business opportunities. KPIs are usually used by companies to track their progress toward a specific goal. In many cases, this means keeping track of things like how well they’re meeting sales goals. But companies now have many data points to use when analysing performance. They will use the metrics that feed the revenue KPIs to look for sales niches that could be taken advantage of by marketing or sales promotions.
- To look into the data and find ways to work more efficiently. They use this information to figure out where more work needs to be done. Companies will then use this information to make plans for their growth in the future.
- To help improve the effectiveness of operations. By looking for things that are going well and things that need work, they can make better use of their resources and keep up high levels of performance.
What are the advantages of using KPI Analytics?
KPI Analystics has a wide range of benefits, some of which are as simple as making sure that performance is on track. Or, they can be as complex as digging deep into data to find small changes in outputs that, if tweaked, could slightly improve performance. But when a company uses a KPI Analytics strategy, they usually get the most out of five main areas.
- Mitigating Risk. By using KPI analytics, companies can better measure and calculate where they stand in terms of risk. These steps help to reduce risks before they become problems or losses.
- Getting services or products to customers or making changes to them. Almost every business’s success comes from being able to give customers what they want. So, it’s important to find out from customers which products or services work and which ones need to be changed or made better. These insights help you understand how customers think and what the market wants, which drives your strategy for developing new products.
- Getting the customer experience right and making it better. By looking at customer interactions from the points of view of “What Happened,” “What Might Happen,” and “What Might Be Done,” companies can give customers a more consistent and personalised experience and make their operations run more smoothly.
- Making better decisions. Companies use KPI Analytics to make decisions faster and based on facts. For example, they use KPI data to drive product development to match consumer markets, and they use data to personalise services. For instance, KPI reporting and dashboards can help find connections between data, giving managers facts on which to base decisions that would not be possible otherwise.
- Better financial knowledge, reduced corners, and increased profits. Using balance sheets, cash flow, and budgets to do a detailed analysis can help a business figure out how healthy its finances are. By digging deeper into expenses like the cost of materials, you can cut costs and make more money.
How to analyze KPIs, metrics, and measures
There are two main types of KPIs that can be looked at. With the reactive method, data is only looked at when there is a problem. It doesn’t help the company do better. Instead, it solves problems as they come up.
The proactive approach is when a company regularly looks at its data to find problems that could happen and fixes them before they do. Both ways can be broken down into 5 main steps:
- Setout your goals. Before you start to analyse, you’ll need to set clear goals that cover the problem or issue you’re trying to solve. This will then give you a plan for the information you will need.
- Define your measurements. For example, if you need to figure out how much each agent is selling, you might want to dig into the data to find out how long each sales cycle takes for each rep. Then, compare each rep’s sales to the average of the whole team.
- Collect your data. The goals set out in step 1 should be taken into account when defining and collecting data. Most of the relevant information will already be in apps, databases, and spreadsheets. Quality is king here. It’s worth the time to check data for accuracy and clean it up where necessary.
- Analyze your data. Dashboards and reports are great ways to start digging into your data with KPI Analytics tools. Most of them will already have some automation and templates to help you get started. Some of them will already talk about the many ways you can look at your strategy. Once you have a method, you can use an app or do it on your own.
- Visualize your KPIs and the results. Once you have the data, the method, and the goal, you can start putting together the cool-looking stuff. Most of the time, this is done with the help of KPI dashboards, which turn complicated data into visuals that are easy for all stakeholders to understand. On the other hand, KPI reports are often used to summarise the data in a table format.
KPI Analytics Software's most important features
Using KPI Analytics software is good for businesses, their stakeholders, and their employees. But what are the most important things to look for in KPI Analytics software?
The most important thing is to keep things simple. Being intuitive and flexible will get you up and running faster. A good KPI analytics app should be flexible enough to let the user make different charts or reports for different teams or departments.
The information should be easy to separate, store, and share in a safe way. The data will be put into a format that can be analysed with other related data by a wide range of automated data sources. With a flexible KPI Dashboard, you can see how your data is being analysed, which makes it easy to share insights with colleagues.
Conclusion
When KPIs are looked at on a regular basis, organisations can find out what is working and what needs to be changed. Now, it’s easier than ever to get this data because both data integration providers and analysis tools are making this process easier to automate.
Because of these improvements, analysing KPIs is no longer just for big companies. Now, any business can do it. Companies can now use their data to improve their processes, reduce risk, and make better choices.
Set your goals first, and then let KPI software like DoerHRM take care of managing and displaying your analysis. Try it out for free to discover how easy it is to monitor KPIs using dashboards and reports.
