Reporting on data gives a clear and actionable picture of how a business is doing. It ties together different metrics and gives a real bird’s-eye view of each role, each department, and the company as a whole.
No matter how big or small your business is, you need to be able to report. It’s also easier than ever for small businesses to set up data reporting systems that are simple and cost-effective. Let’s take a look at how.
What is Data Reporting?
Data reporting is the process of gathering, organising, and displaying raw data so that a business’s performance can be evaluated in real-time and over time.
Reporting on data is important for any business. It lets you make decisions based on facts that are good for your business instead of gut decisions that may or may not be good for your business.
Think of it like taking a car for a test drive. It’s the best of the best, brand new, and you’ve heard good things about the model. Even if you have a good feeling about it, you might not want to start driving until you can see the dashboard computer. Even if the brand is well-known, you need to see how the car runs and if there are any problems. In business, it’s the same way.
Data Reporting vs Business Intelligence
Now that we know how important it is to have a data reporting strategy, let’s look at how it differs from business intelligence.
People talk about data reporting and business intelligence in the same way sometimes, but that’s not always right. Here’s how to tell the difference between the two:
Reporting lets you know what’s happened and how your business is doing. This information can be shown in charts, graphs, tables, and other ways on reporting dashboards.
Business intelligence (BI) tells you what happened and why, and it helps you spot trends and risks so you can improve your business’s performance in the future. With BI tools, you can look at metrics like customer satisfaction, changes in demand, and cash flow and make predictions about them.
With data reporting and business intelligence apps in your stack, your business can be in the best position to evaluate its current performance, predict how it will change in the coming months, and respond to trends and risks.
Types of Data Reporting
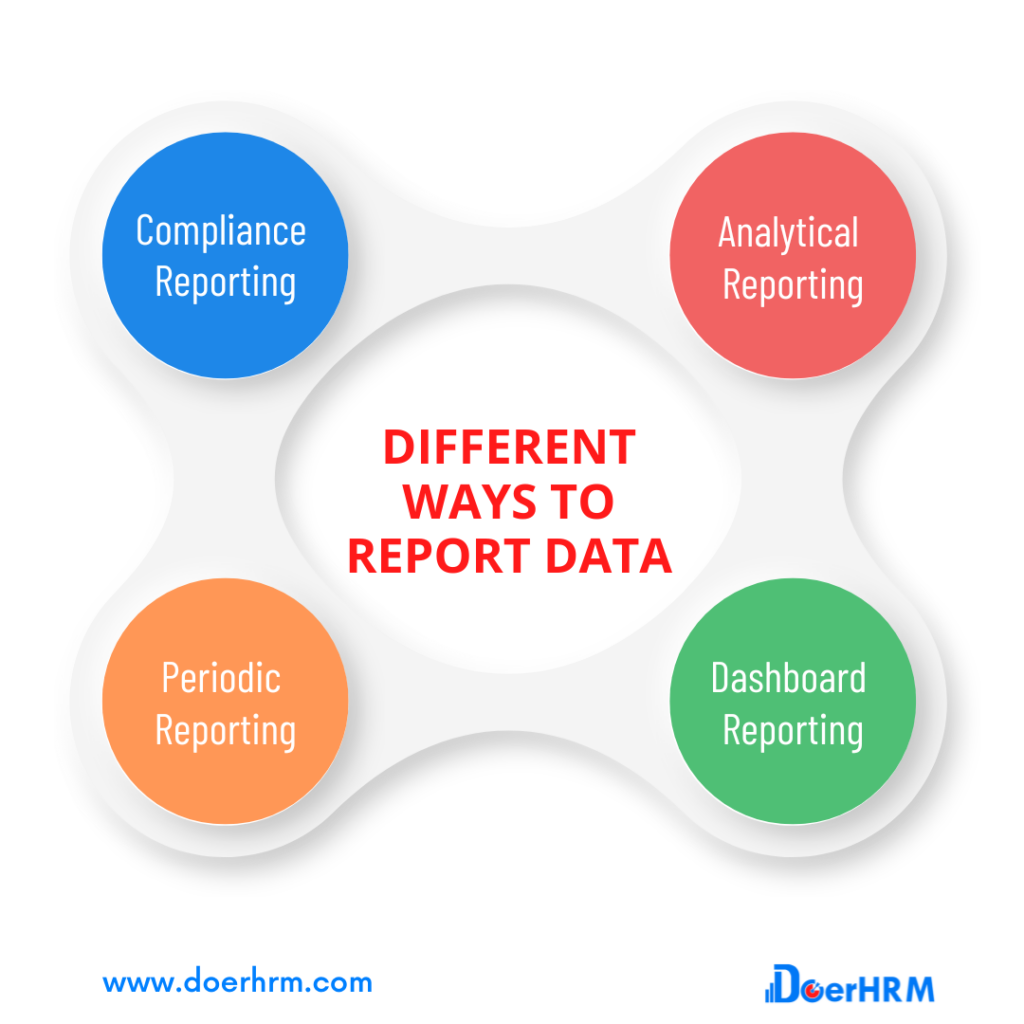
There are a lot of different ways to report data. Here are some of the most common kinds. All of these can help businesses keep track of how far they’ve come in reaching their goals.
Compliance Reporting
Compliance reporting usually shows how the company and/or customer data is collected, stored, shared, and kept safe. This kind of reporting is necessary to show that a company is meeting all of the requirements set by a government or regulatory agency under a certain standard.
Analytical Reporting
Analytical reporting uses qualitative and quantitative data when analysing a business plan or process. The goal is to gather, analyse, and present information so that the next step can be decided. For example, a market analysis could help a business figure out how to use its resources most effectively. If the analysis shows that a certain market is growing and getting more competitive, the company may decide to put more money into promoting that product.
Periodic Reporting
Reporting on a regular schedule gives summaries of performance data at regular times. These times can be every hour, every day, every week, every month, every three months, or every year. This type of reporting is best for telling a group of stakeholders about a company’s performance because it shows how the company has grown over time.
Dashboard Reporting
Dashboard reporting shows how a company or team is doing regarding its key performance indicators (KPIs). Dashboard reporting uses charts and graphs to give a quick, multidimensional look at how a company or team is doing by combining data from multiple reports and tools.
How Small Businesses Can Use Data Reporting Strategy
Not all tools for reporting are the same. Even though there are a lot of fancy analytics apps on the market, the best data reporting app is the one that your business can actually use and learn from. For small businesses, this usually means making things easy to understand and not making things hard.
Know what your business needs from a data reporting platform before you choose one. Here are some of the most important parts of a report that most small businesses should pay attention to.
- Dashboards and reports that can be changed
- Easy to use; can gather data from multiple sources in one place
- A variety of forms for making reports
- Different kinds of charts
- Design that looks good and lets you add notes for context
- Easy to share with key players
Now that we know what to look for, let’s take a look at some of the data reporting examples:
Dashboard for Key Performance Indicator (KPI)
A KPI dashboard shows key performance metrics in a visual way. Some of the best KPIs to include are website traffic, new contacts, new customers, and monthly sales. At a glance, you should be able to see how well your business is doing, ideally compared to the monthly and yearly goals you’ve set.
Dashboard for Website Performance
If your small business is like most, your website is a key way to sell and promote your products and services. It’s very important that it works well, or you could lose valuable leads. The good news is that you can easily track how well your website is doing with a simple dashboard that uses data from Google Analytics or a similar service. Page views, views per source, time on page, and bounce rate are some of the most important website metrics.
Dashboard for Service Performance
Another important thing to pay attention to is customer service and support. After all, if your customer churn rate is too high, your sales and marketing efforts will be for nothing. Customer satisfaction metrics, churn rates, and ticket response times are all useful metrics to track.
Although trusting your gut is important, it’s not enough to gauge your company’s health. No matter the size or nature of your company, you can get an accurate and timely read on its health thanks to a data reporting strategy. You can be certain that your company is making progress in the right way if you have access to data-driven insights that let you focus on the areas that matter most.