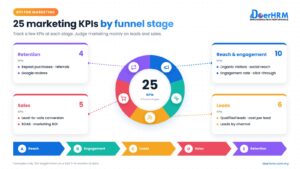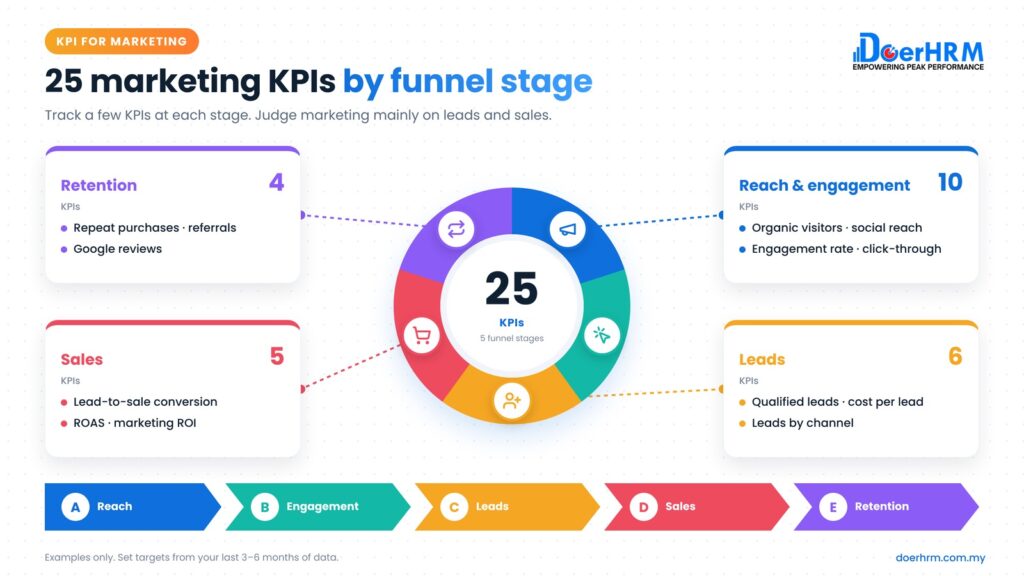
The best KPI for marketing is one that connects marketing activity to sales. Track a few KPIs at each stage of the funnel (reach, engagement, leads, sales and retention) and judge marketing mainly on qualified leads, cost per lead and revenue from marketing, not on likes or followers.
Key takeaways
- Group marketing KPIs by funnel stage: reach → engagement → leads → sales → retention.
- The 3 KPIs most marketing teams should be judged on: qualified leads, cost per lead, and lead-to-sale conversion.
- Likes, followers and impressions are useful signals, not performance KPIs on their own.
- Offline marketing (events, exhibitions, print, referrals) can be measured too. Track the leads each channel brings.
- Set targets from your own baseline, not from global benchmarks.
By Ng Shone Fone, Founder and CEO of DoerHRM, with 30 years in business.
What are good KPIs for digital marketing?
Good digital marketing KPIs measure results, not just activity: qualified leads, cost per lead, conversion rate, revenue from marketing and return on ad spend. Reach and engagement KPIs help explain those results.
In our workshops, we often hear: “Likes went up, but sales didn’t.” That happens when marketing is measured only on social media numbers. Link at least half of the marketing scorecard to leads and sales.
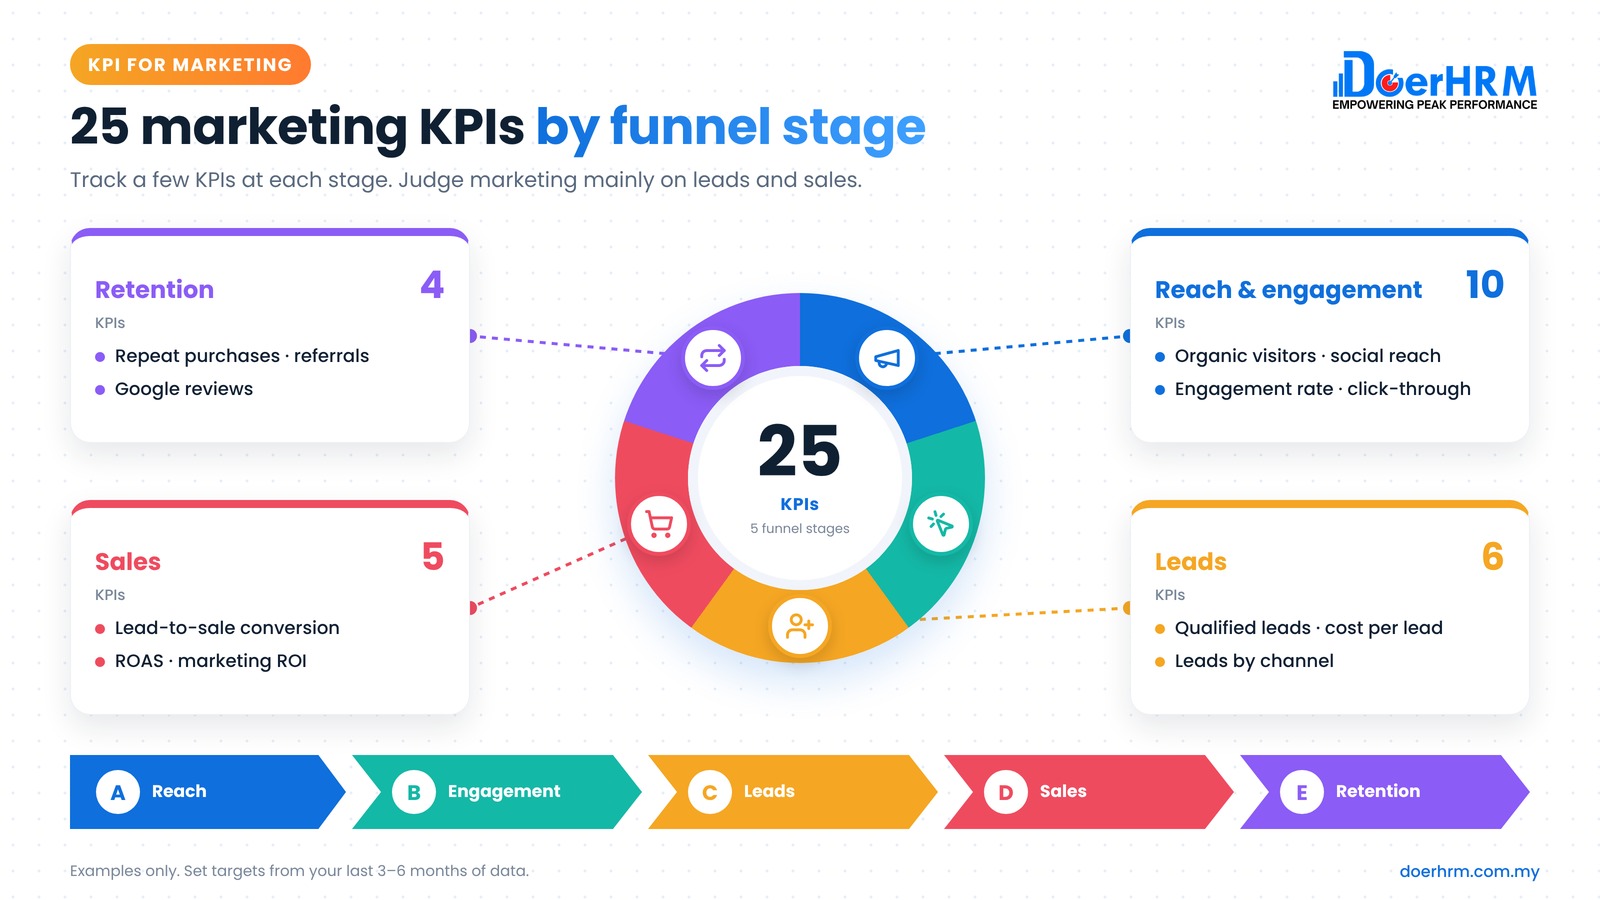
25 marketing KPIs by funnel stage
Stage 1: Reach (awareness)
| # | KPI | Formula / how to measure |
|---|---|---|
| 1 | Website visitors (organic) | Visitors from search engines per month (Google Analytics) |
| 2 | Search visibility | Number of target keywords in Google’s top 10 |
| 3 | Social media reach | Unique people who saw your posts |
| 4 | Share of voice | Your brand mentions ÷ total mentions in your category |
| 5 | Event and exhibition reach | Visitors to your booth or event |
Stage 2: Engagement
| # | KPI | Formula / how to measure |
|---|---|---|
| 6 | Engagement rate (social) | (Reactions + comments + shares) ÷ reach × 100% |
| 7 | Click-through rate (ads, email) | Clicks ÷ impressions (or emails delivered) × 100% |
| 8 | Email open rate | Opens ÷ emails delivered × 100% |
| 9 | Pages per visit / time on site | From Google Analytics |
| 10 | Content downloads | Downloads of templates, e-books or brochures |
Stage 3: Leads
| # | KPI | Formula / how to measure |
|---|---|---|
| 11 | Total leads | Enquiries, form fills, WhatsApp chats, booth sign-ups |
| 12 | Qualified leads (MQL) | Leads that meet agreed criteria (e.g. right company size) |
| 13 | Cost per lead (CPL) | Marketing spend ÷ number of leads |
| 14 | Cost per qualified lead | Marketing spend ÷ qualified leads |
| 15 | Landing page conversion rate | Form submissions ÷ landing page visitors × 100% |
| 16 | Leads by channel | Leads from each channel (search, ads, social, events, referrals) |
Stage 4: Sales
| # | KPI | Formula / how to measure |
|---|---|---|
| 17 | Lead-to-sale conversion rate | Leads that became customers ÷ total leads × 100% |
| 18 | Revenue from marketing leads | Sales from customers who came through marketing |
| 19 | Return on ad spend (ROAS) | Revenue from ads ÷ ad spend |
| 20 | Customer acquisition cost (CAC) | Sales and marketing cost ÷ new customers |
| 21 | Marketing ROI | (Revenue from marketing − marketing cost) ÷ marketing cost × 100% |
Stage 5: Retention and loyalty
| # | KPI | Formula / how to measure |
|---|---|---|
| 22 | Repeat purchase rate | Customers who bought again ÷ total customers × 100% |
| 23 | Customer lifetime value (CLV) | Average order value × purchases per year × years as customer |
| 24 | Referral leads | Leads from customer referrals |
| 25 | Online review rating | Average Google review rating and number of new reviews |
Which KPI for marketing executives should you set?
Give a marketing executive 4–6 KPIs, with most of the weight on leads and conversion. Here is an illustrative scorecard for a B2B company.
| KPI | Weightage | Example target | Stage |
|---|---|---|---|
| Qualified leads | 30% | 60 a month | Leads |
| Cost per qualified lead | 20% | RM40 or less | Leads |
| Lead-to-sale conversion | 20% | 10% | Sales |
| Organic website visitors | 10% | +20% vs last year | Reach |
| Content published on schedule | 10% | 95% | Activity |
| New Google reviews | 10% | 4 a month | Retention |
| Total | 100% |
Targets are examples. Set yours from the last 3–6 months of data. Build this scorecard with our free KPI templates.
For more role examples, see employee KPI examples and our sales KPI examples, because marketing and sales KPIs should connect.
How do you set marketing KPI targets?
Start from the sales target, work backwards through the funnel, then check against your recent baseline.
Example (illustrative): the sales team needs 10 new customers a month.
- 10% of qualified leads become customers → you need 100 qualified leads a month.
- About 60% of all leads are qualified → marketing must produce about 170 leads in total (100 ÷ 60%).
- Cost per lead is RM35 → the budget needed is about RM6,000 a month (170 × RM35).
If the budget is smaller, improve conversion or find cheaper channels before raising the lead target.
How do you measure offline marketing?
Give every offline channel its own way to capture leads, then track leads and sales by channel.
- Exhibitions and events: booth sign-up form or QR code; count leads and follow-up meetings.
- Print and outdoor: a dedicated phone number, WhatsApp link or promo code.
- Seminars and workshops: registrations, attendance rate, and leads from attendees.
- Referrals: ask every new customer “How did you hear about us?” and record it.
Common marketing KPI mistakes
- Vanity metrics as KPIs. Followers and likes alone don’t show business results.
- No lead definition. Sales and marketing argue about “good leads” unless qualified leads are defined together.
- Not tracking by channel. You can’t cut the weakest channel if you don’t know which it is.
- Targets copied from global benchmarks. Malaysian B2B markets differ; use your own baseline.
- Too many KPIs. Track 25 if you like, but put only 4–6 on each person’s scorecard.
Frequently asked questions
What are good KPIs for digital marketing? Qualified leads, cost per lead, landing page conversion rate, lead-to-sale conversion and return on ad spend. Reach and engagement KPIs such as visitors and click-through rate help explain those results.
What is the most important marketing KPI? For most B2B companies, it is qualified leads or revenue from marketing leads, because they connect marketing directly to sales.
How many KPIs should a marketing team track? A team can monitor 15–25 metrics, but each person’s scorecard should have 4–6 KPIs, with most weight on leads and conversion.
What is the difference between a marketing KPI and a metric? A metric is any number you can track, such as likes. A KPI is a metric tied to a business goal, with a target and an owner, such as 60 qualified leads a month.
How do you measure social media KPIs? Track reach, engagement rate and clicks in each platform’s insights (see our social media KPIs guide), then track leads from social in your website analytics or CRM. Judge social on leads, not just likes.
What are offline marketing KPIs? Event and exhibition leads, cost per event lead, seminar attendance rate, referral leads and leads from print or outdoor campaigns using unique codes or numbers.
Conclusion
Measure marketing by funnel stage, put most of the weight on qualified leads, cost per lead and conversion, and set targets by working backwards from the sales target. Use reach and engagement to explain results, not to judge them.
Want your marketing and sales managers to build KPIs that connect? Request a customised KPI workshop proposal.
Ng Shone Fone is the Founder and CEO of DoerHRM and Group CEO of Obsnap. With 30 years in business, he helps Malaysian companies set KPIs and OKRs that drive results.