Operational KPI (Key Performance Indicators) are specific metrics that businesses use to measure their performance in key areas of their operations. These metrics are used to track progress towards achieving specific goals, and to identify areas where improvements can be made. Operational KPIs are important because they provide a clear picture of a business’s performance, allowing owners and managers to make informed decisions that can drive growth and profitability.
By tracking Operational KPIs, businesses can identify areas of their operations that may need attention, and can take steps to improve performance. For example, a business that tracks its Customer Acquisition Cost (CAC) can determine whether it is spending too much to acquire new customers, and can adjust its marketing strategy accordingly. Similarly, a business that tracks its On-Time Delivery Rate can identify issues in its supply chain that may be causing delays, and can take steps to address those issues to improve customer satisfaction.
In short, tracking Operational KPIs is crucial for businesses that want to remain competitive and profitable. By monitoring these metrics, businesses can gain valuable insights into their operations and make data-driven decisions that can drive growth and improve their bottom line.
In this article we will discover about what Operational KPIs are , their importance in tracking business performance ,28 Best Operational KPIs for Every Business to Track , Examples of Operational KPIs in Action, Templates for Tracking Operational KPIs and The Meaning Behind Operational KPIs
Table of Contents
What Are Operational KPI?
Definition of Operational KPI and their role in business operations
Operational KPIs (Key Performance Indicators) are specific metrics that businesses use to measure their performance in key areas of their operations. These metrics are typically focused on measuring efficiency, effectiveness, and productivity in various departments or functions within the organization. The KPIs selected will depend on the business’s objectives, strategies, and goals.
The role of Operational KPIs in business operations is to provide a way to measure and monitor performance in key areas, such as sales, marketing, customer service, logistics, and finance. By tracking these metrics, businesses can gain valuable insights into their operations, and can use this data to make informed decisions about where to focus their efforts to improve performance.
For instance, a business that tracks its customer retention rate can measure the percentage of customers who continue to use its products or services over time, which is a critical indicator of customer satisfaction and loyalty. This KPI helps businesses understand how well they are retaining their customers, and how they can improve customer satisfaction.
Similarly, a business that tracks its Average Handle Time (AHT) can measure the average amount of time that it takes for a customer service representative to resolve a customer inquiry or issue. This KPI can help the business assess the efficiency of its customer service operations, identify bottlenecks, and take corrective actions.
Overall, Operational KPIs provide businesses with the information they need to make data-driven decisions about their operations. By monitoring these metrics, businesses can stay on top of their performance, identify areas for improvement, and take steps to drive growth and profitability.
Examples of how KPIs can help businesses make informed decisions and achieve their objectives
Operational KPIs can help businesses make informed decisions and achieve their objectives in several ways. Here are some examples:
Identify areas for improvement: KPIs can help businesses identify areas of their operations that are underperforming or not meeting expectations. For instance, if a business has a low customer retention rate, it can use this KPI to investigate why customers are leaving and take steps to improve their experience.
Monitor progress towards goals: KPIs can help businesses track their progress towards achieving specific goals. For example, if a business has a revenue target for the year, it can monitor its sales performance against this KPI to ensure that it is on track to achieve its goal.
Make data-driven decisions: KPIs provide businesses with objective data on their performance, which can be used to make informed decisions. For instance, if a business is deciding whether to invest in a new marketing campaign, it can use KPIs such as customer acquisition cost (CAC) and customer lifetime value (CLV) to evaluate the potential return on investment.
Monitor employee performance: KPIs can be used to track employee performance and identify areas where additional training or support may be needed. For example, if a business has a high call abandonment rate in its customer service department, it can use this KPI to identify employees who may need additional training on how to handle customer inquiries more efficiently.
Benchmark performance against industry standards: KPIs can be used to compare a business’s performance against industry benchmarks and best practices. For example, a business may track its inventory turnover rate and compare it to the average for its industry to identify opportunities for improvement
Related article : Practical KPI Examples
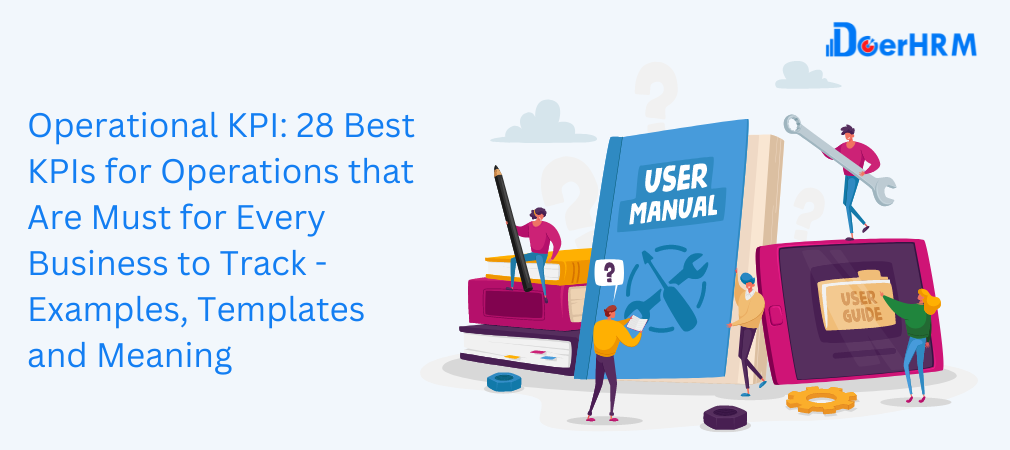
28 Best Operational KPI for Every Business to Track
1. Revenue Growth Rate - Operational KPI
Revenue growth rate is a critical operational KPI that measures the rate at which a company’s revenue is increasing or decreasing over a specific period. By tracking revenue growth rate, businesses can determine if their revenue is increasing at a sustainable rate or if it is declining. This KPI is essential because it provides insight into a company’s financial health and its ability to generate revenue over time.
To calculate revenue growth rate, you need to take the revenue from the current period and subtract the revenue from the previous period. Then, divide the result by the revenue from the previous period and multiply the result by 100 to get a percentage.
For example, if a company’s revenue was $1 million last year and $1.5 million this year, the revenue growth rate would be (1.5-1)/1*100= 50%.
By tracking revenue growth rate, businesses can identify areas where they need to improve to increase their revenue. For example, if the revenue growth rate is declining, the business may need to revisit its pricing strategy, explore new markets, or invest in marketing and advertising to increase sales. On the other hand, if the revenue growth rate is increasing, the business can continue with its current strategy and possibly allocate more resources to grow faster.
2. Cost of Goods Sold (COGS) - Operational KPI
Cost of Goods Sold (COGS) is another critical operational KPI that measures the cost of producing the goods or services sold by a business. This KPI is essential because it helps businesses determine their gross profit margin and profitability.
To calculate COGS, businesses need to take into account all the costs associated with producing the goods or services sold, such as direct labor, raw materials, and production overhead. Once all the costs are added up, the total is divided by the number of units produced to get the COGS per unit.
By tracking COGS, businesses can identify ways to reduce their costs and improve their profitability. For example, if the COGS is too high, the business may need to consider sourcing cheaper raw materials, optimizing production processes, or negotiating better supplier contracts. Lowering the COGS can help businesses improve their gross profit margins and increase their overall profitability.
COGS can also be used to compare a company’s performance to its competitors in the same industry. A higher COGS than competitors can indicate that a company is not as efficient in producing goods or services, which could lead to lower profits and a compet
3. Customer Acquisition Cost (CAC) - Operational KPI
Customer Acquisition Cost (CAC) is a vital operational KPI that measures the total cost a business spends on acquiring a new customer. This KPI is critical because it helps businesses understand how much they need to invest in marketing and sales efforts to acquire a new customer, and whether the investment is worth the return.
To calculate CAC, businesses need to take into account all the costs associated with acquiring a new customer, including advertising, marketing, sales, and any other related expenses. The total cost is then divided by the number of new customers acquired in the same period to get the CAC per customer.
By tracking CAC, businesses can identify ways to optimize their marketing and sales efforts to acquire new customers more efficiently and cost-effectively. For example, if the CAC is too high, the business may need to consider targeting a different audience, investing in more effective marketing channels, or improving their sales process.
Tracking CAC is also essential for measuring the effectiveness of a business’s marketing and sales efforts. A lower CAC indicates that a business is acquiring new customers more efficiently and cost-effectively, leading to higher profitability and growth potential.
Overall, CAC is a critical operational KPI for businesses to ensure that they are acquiring new customers at an efficient cost and maintaining profitability. By tracking CAC, businesses can optimize their marketing and sales efforts to drive growth and increase their bottom line.
4. Inventory Turnover - Operational KPI
Inventory turnover is a crucial operational KPI that measures how many times a business sells and replaces its inventory over a specific period, usually a year. This KPI helps businesses understand how quickly they are selling their inventory and whether they need to adjust their purchasing or production strategies.
To calculate inventory turnover, businesses need to divide the cost of goods sold (COGS) by the average inventory level for the same period. The resulting number represents how many times the business sells and replaces its inventory in a year.
A high inventory turnover indicates that a business is efficiently managing its inventory, selling products quickly, and generating revenue. On the other hand, a low inventory turnover indicates that a business may be holding too much inventory, leading to increased carrying costs and potentially outdated or unsold products.
By tracking inventory turnover, businesses can adjust their inventory management strategies to optimize their supply chain and reduce costs. For example, if the inventory turnover is low, the business may need to adjust its purchasing or production levels to reduce inventory holding costs.
Overall, inventory turnover is a critical operational KPI for businesses to track their inventory management efficiency, maintain cash flow, and improve profitability. By tracking inventory turnover, businesses can make informed decisions about their inventory levels, supply chain, and production strategies to optimize their operations and increase their bottom line.
5. Employee Turnover Rate - Operational KPI
Employee turnover rate is an essential operational KPI that measures the percentage of employees who leave a company during a specific period, usually a year. This KPI helps businesses understand how well they are retaining their employees and whether they need to improve their employee retention strategies.
To calculate employee turnover rate, businesses need to divide the number of employees who leave the company during the period by the average number of employees during the same period. The resulting number represents the percentage of employees who leave the company each year.
A high employee turnover rate indicates that a business may have issues with employee engagement, job satisfaction, or company culture. It can also be a sign that the business is not offering competitive compensation or benefits, leading to employee dissatisfaction and higher turnover rates.
On the other hand, a low employee turnover rate indicates that a business is retaining its employees, and employees are satisfied with their jobs and the company. This can result in improved productivity, customer satisfaction, and overall profitability.
By tracking employee turnover rate, businesses can identify areas for improvement in their employee retention strategies. For example, if the turnover rate is high, the business may need to improve its training and development programs, offer better compensation and benefits packages, or improve its company culture to retain its employees.
Overall, employee turnover rate is a critical operational KPI for businesses to track their employee retention strategies and improve overall employee satisfaction, productivity, and profitability. By monitoring and improving employee retention, businesses can reduce turnover costs, maintain a stable workforce, and enhance their reputation as an employer of choice in the industry.
6. Customer Lifetime Value (CLV) - Operational KPI
Customer Lifetime Value (CLV) is an operational KPI that estimates the total value of a customer to a business over their lifetime. This KPI helps businesses understand the long-term revenue potential of each customer and make informed decisions about customer acquisition and retention strategies.
To calculate CLV, businesses need to multiply the average value of a customer’s purchase by the number of purchases they make in a year and then multiply that number by the estimated number of years the customer will continue doing business with the company.
For example, if the average customer spends $100 per purchase and makes five purchases per year, and the estimated length of their relationship with the company is five years, then their CLV would be $2,500.
By tracking CLV, businesses can identify their most valuable customers and allocate their resources accordingly. For example, businesses may want to focus more on retaining their high-value customers or investing more in marketing and sales strategies that target similar customers.
CLV can also help businesses make informed decisions about pricing, product development, and customer service. For instance, if the CLV of a customer segment is high, the business may want to invest more in developing new products or services to meet the needs of those customers.
Overall, Customer Lifetime Value is an essential operational KPI for businesses to understand the value of their customer base and make informed decisions about customer acquisition and retention strategies. By tracking and improving CLV, businesses can increase customer loyalty, boost revenue, and drive long-term growth.
7. Net Promoter Score (NPS) - Operational KPI
Net Promoter Score (NPS) is a commonly used operational KPI that measures the loyalty and satisfaction of a business’s customers. It is a simple yet effective way to gauge how likely customers are to recommend a business to others.
The NPS is based on a single question survey that asks customers to rate how likely they are to recommend the business to friends or family on a scale of 0 to 10. Based on their response, customers are categorized into three groups:
- Promoters: Those who respond with a score of 9 or 10 are considered promoters. They are highly satisfied with the business and are likely to recommend it to others.
- Passives: Those who respond with a score of 7 or 8 are considered passives. They are generally satisfied with the business, but are not as enthusiastic as promoters and may be more likely to switch to a competitor.
- Detractors: Those who respond with a score of 0 to 6 are considered detractors. They are dissatisfied with the business and are likely to share their negative experiences with others.
To calculate the NPS, businesses subtract the percentage of detractors from the percentage of promoters. The result is a score between -100 and +100.
NPS is an important operational KPI because it helps businesses measure the overall satisfaction and loyalty of their customers. By tracking changes in their NPS over time, businesses can identify areas where they need to improve and take action to address customer concerns. They can also use the NPS to benchmark their performance against competitors and industry standards.
NPS data can be used in a variety of ways, including to inform marketing and sales strategies, identify opportunities for process improvement, and develop new products or services. Overall, NPS is a valuable operational KPI for businesses to track because it provides insights into customer satisfaction, loyalty, and advocacy.
8. Order Fulfillment Cycle Time - Operational KPI
Order Fulfillment Cycle Time is a crucial operational KPI that measures the time it takes for a business to fulfill an order, from the moment it is received to the point of delivery. This metric tracks the efficiency of a company’s order fulfillment process, and a shorter cycle time is generally better.
To calculate Order Fulfillment Cycle Time, a business must record the time taken to fulfill an order, including the time taken for processing, packaging, shipping, and delivery. This KPI can also be broken down by individual steps in the fulfillment process to identify areas of improvement.
By tracking Order Fulfillment Cycle Time, a business can improve its overall operational efficiency, reduce costs, and increase customer satisfaction by delivering orders faster. A shorter cycle time can also improve cash flow by reducing the time it takes to convert inventory into revenue.
9. On-Time Delivery Rate - Operational KPI
On-Time Delivery Rate is a key operational KPI that measures the percentage of orders delivered to customers within the expected delivery window. This KPI is critical for businesses that rely on timely delivery to meet customer expectations and maintain a competitive edge.
To calculate On-Time Delivery Rate, a business must first define the expected delivery window for each order. Then, the actual delivery time is compared to the expected delivery time, and the percentage of orders delivered on time is calculated.
Tracking On-Time Delivery Rate can help a business identify and address bottlenecks or inefficiencies in its supply chain and logistics operations. Improving this KPI can result in increased customer satisfaction, reduced shipping costs, and increased revenue from repeat business and positive word-of-mouth referrals.
On-Time Delivery Rate can also be used to monitor the performance of third-party logistics providers or carriers and to negotiate better rates and service level agreements. By consistently meeting or exceeding customer delivery expectations, a business can build a reputation for reliability and become a preferred provider in its industry.
10. Gross Profit Margin - Operational KPI
Gross Profit Margin is a financial KPI that measures the profitability of a business by calculating the percentage of revenue that remains after deducting the cost of goods sold (COGS). This KPI is essential for businesses to understand their financial health and make informed decisions about pricing, inventory management, and cost control.
To calculate Gross Profit Margin, the formula is as follows:
Gross Profit Margin = (Revenue – COGS) / Revenue x 100%
COGS includes the direct costs associated with producing and delivering goods or services, such as materials, labor, and shipping costs. Revenue refers to the total income generated from sales, including returns and discounts.
A higher Gross Profit Margin indicates that a business is generating more revenue than it is spending on COGS. This can be achieved through various strategies, such as increasing prices, reducing production costs, and improving efficiency.
Conversely, a lower Gross Profit Margin indicates that a business may be facing challenges with pricing, inventory management, or production costs. By tracking Gross Profit Margin over time, businesses can identify trends and take corrective action to improve profitability.
Gross Profit Margin is a critical KPI for businesses in any industry, as it provides insights into the efficiency of their operations and the effectiveness of their pricing strategies. By maintaining a healthy Gross Profit Margin, businesses can ensure long-term sustainability and profitability.
11. Return on Investment (ROI) - Operational KPIs
Return on Investment (ROI) is a financial metric that measures the profitability of an investment. It is calculated by dividing the net profit of an investment by the cost of the investment and expressing the result as a percentage.
For example, if a business invests $10,000 in a marketing campaign and generates $15,000 in revenue as a result, the net profit of the investment is $5,000. Dividing this by the cost of the investment ($10,000) gives an ROI of 50%.
ROI is an important KPI for businesses to track because it provides insight into the effectiveness of their investments. By comparing the ROI of different investments, businesses can make informed decisions about where to allocate their resources for maximum profitability. A high ROI indicates that an investment is generating significant profits relative to its cost, while a low ROI suggests that an investment may not be worth the cost and should be reconsidered.
12. Customer Retention Rate - Operational KPIs
Customer retention rate is a KPI that measures the percentage of customers who continue to do business with a company over a certain period of time. It is calculated by dividing the number of customers retained by the total number of customers, and expressing the result as a percentage.
For example, if a business starts with 100 customers at the beginning of the year and ends with 80 customers at the end of the year, their customer retention rate for the year is 80%. This means that 80% of the customers who started doing business with the company at the beginning of the year continued to do so throughout the year.
Customer retention rate is an important KPI for businesses to track because it provides insight into customer loyalty and the effectiveness of customer retention strategies. A high retention rate indicates that customers are satisfied with the company’s products or services and are more likely to continue doing business with the company in the future. On the other hand, a low retention rate may indicate that customers are not satisfied and may be switching to competitors. By tracking this KPI, businesses can identify areas for improvement in customer service, marketing, and other areas to improve customer satisfaction and loyalty.
13. Average Revenue per User (ARPU) - Operational KPIs
Average Revenue per User (ARPU) is a financial metric that measures the average amount of revenue a business generates from each of its customers. It is calculated by dividing the total revenue generated by the total number of customers or users over a given period.
ARPU is an important metric for businesses that rely on a recurring revenue model, such as subscription-based services or membership programs. By monitoring ARPU, businesses can track the effectiveness of their pricing strategies, identify opportunities for upselling and cross-selling, and measure the overall health of their customer base.
For example, if a subscription-based business has 1,000 customers and generates $100,000 in revenue over a month, its ARPU would be $100 ($100,000 / 1,000). By tracking ARPU over time, the business can identify trends and make data-driven decisions to optimize its revenue streams.
14. Website Traffic - Operational KPIs
Website traffic refers to the number of visitors that a website receives within a specific period. This KPI is an essential metric that helps businesses understand how well their website is performing and how effective their digital marketing strategies are in attracting and retaining visitors.
By monitoring website traffic, businesses can determine which pages or content are most popular, how long visitors stay on their website, and where they come from. This information can be used to optimize website design and content, improve user experience, and identify opportunities to generate more traffic and leads.
There are several tools available to measure website traffic, including Google Analytics, which provides detailed insights into website performance, including the number of sessions, pageviews, bounce rate, and average session duration. By tracking website traffic over time, businesses can identify trends, track the impact of marketing campaigns, and make data-driven decisions to improve their online presence.
15. Conversion Rate - Operational KPIs
Conversion rate is a crucial operational KPI that businesses track to measure their website or marketing campaign’s effectiveness in converting visitors into customers or leads. The formula to calculate the conversion rate is the number of conversions divided by the total number of visitors or impressions multiplied by 100. For instance, if a website had 1000 visitors and 50 of them made a purchase, then the conversion rate would be 5%.
Tracking the conversion rate helps businesses evaluate the efficiency of their marketing campaigns or website design and identify areas of improvement. By tracking the conversion rate, businesses can determine the most effective tactics and improve them to maximize their return on investment. Improving the conversion rate can also help businesses reduce customer acquisition costs and boost revenue.

16. Employee Productivity - Operational KPIs
Employee productivity is a metric that measures the efficiency of employees in completing their tasks and achieving business objectives. It is an essential KPI for businesses because it can directly impact the company’s performance and profitability. High employee productivity can lead to increased output, improved quality, and faster completion of tasks, resulting in greater revenue generation and cost savings for the organization.
Employee productivity can be measured in various ways, such as the number of tasks completed in a given period, the amount of time taken to complete a task, and the quality of the output produced. By tracking employee productivity, businesses can identify areas of improvement, optimize workflows, and provide targeted training and development to employees.
There are several factors that can impact employee productivity, such as work environment, workload, technology and tools, employee engagement and motivation, and training and development opportunities. Therefore, businesses should continually monitor and evaluate these factors to ensure that they are optimizing their employee productivity and achieving their operational goals.
17. Time to Hire - Operational KPIs
Time to Hire is an Operational KPI that measures the amount of time it takes a company to fill a job vacancy. It helps businesses understand their recruitment process’s efficiency and identify areas that need improvement.
A long time to hire can be an indicator of inefficiency, which can lead to increased costs and a negative impact on business operations. On the other hand, a short time to hire can result in hiring the wrong person for the job, which can have a detrimental effect on business performance.
By tracking Time to Hire as an Operational KPI, businesses can optimize their recruitment process and improve their overall productivity. This KPI can also help businesses understand the average time it takes to fill specific roles, allowing them to better plan for future hiring needs.
18. Employee Satisfaction - Operational KPIs
Employee Satisfaction is an operational KPI that measures the level of contentment employees feel toward their job and the organization they work for. It is a critical KPI as it helps businesses to identify the level of morale and motivation among employees. Higher employee satisfaction leads to higher productivity, lower turnover rates, and better overall performance.
Measuring employee satisfaction can be done through surveys, interviews, or focus groups. The survey questions should focus on areas such as compensation, benefits, job security, work-life balance, and opportunities for growth and development.
The results of the survey can provide insights into the areas where the organization needs to improve to boost employee satisfaction. By addressing the issues raised in the survey, the organization can increase employee satisfaction and ultimately improve its performance.
19. Employee Absenteeism Rate - Operational KPIs
Employee Absenteeism Rate is a KPI that measures the number of days employees are absent from work as a percentage of their total working days. It is an important metric for businesses to track as it can impact productivity, employee morale, and ultimately the bottom line.
High levels of absenteeism can be a sign of underlying issues within the workplace, such as poor working conditions, low job satisfaction, or a lack of employee engagement. By tracking this KPI, businesses can identify areas of concern and take steps to address them.
A high absenteeism rate can result in increased costs for businesses, such as the need to hire temporary staff or pay overtime to cover the absent employee’s workload. In addition, it can impact team morale and productivity, leading to decreased levels of output and potentially even revenue loss.
By monitoring the absenteeism rate, businesses can take proactive steps to address the root causes of absenteeism, such as improving working conditions, offering flexible work arrangements, or providing employee support programs. This can ultimately lead to a more engaged and productive workforce, which can positively impact the bottom line.
20. First Contact Resolution Rate - Operational KPIs
First Contact Resolution Rate (FCR) is a KPI that measures the percentage of customer inquiries or problems that are resolved on the first contact with customer service representatives. The higher the FCR, the more efficient and effective the customer service team is in addressing customer issues.
By tracking FCR, businesses can identify areas for improvement in their customer service processes and training programs, ultimately resulting in improved customer satisfaction and loyalty. High FCR rates also lead to cost savings for businesses, as multiple interactions with customers for the same issue are reduced, resulting in fewer resources spent on resolving issues.
To calculate FCR, businesses can divide the number of customer inquiries or problems resolved on the first contact by the total number of customer inquiries or problems received during a specific period and multiply the result by 100 to get the percentage.
21. Average Handle Time - Operational KPIs
Average Handle Time (AHT) is a metric that measures the average amount of time it takes for an agent to handle a customer interaction, such as a call or a chat. This KPI is commonly used in call centers or customer support centers to evaluate the efficiency of their agents.
A high AHT could indicate that agents are taking too long to resolve issues, causing frustration and longer wait times for customers. On the other hand, a low AHT could suggest that agents are rushing through interactions and not giving customers the attention they need.
It’s important to note that AHT should not be the only metric used to evaluate agent performance. Quality of service, customer satisfaction, and other KPIs should also be taken into account to get a comprehensive understanding of agent performance.
22. Customer Churn Rate - Operational KPI
Customer Churn Rate is a metric that measures the rate at which customers are leaving the business over a specific period. It is a critical operational KPI because it gives insight into the company’s ability to retain customers, which is vital to long-term success.
To calculate Customer Churn Rate, divide the number of customers lost during a specific period by the total number of customers at the beginning of that period. This metric is expressed as a percentage.
For example, if a company had 100 customers at the start of the month and lost 10 customers during that month, the churn rate would be 10%.
Tracking Customer Churn Rate can help businesses identify customer retention issues and take steps to address them. A high churn rate can indicate problems with customer satisfaction or inadequate product or service quality. Businesses can use this metric to identify areas for improvement and implement changes that improve customer loyalty and retention rates.
23. Customer Complaint Resolution Time - Operational KPI
Customer Complaint Resolution Time is a KPI that measures the amount of time taken to resolve customer complaints. It is calculated by tracking the time from when the complaint is received to when it is resolved. This KPI is important because timely resolution of complaints can help businesses retain customers and prevent negative reviews or damage to their reputation.
A long complaint resolution time may indicate issues with customer service, inefficient complaint handling processes, or lack of training for staff. On the other hand, a short resolution time may indicate effective processes and customer-focused service.
Businesses can improve their complaint resolution time by implementing efficient processes, investing in customer service training, and using technology to streamline the complaint handling process. Additionally, regularly tracking this KPI can help identify areas of improvement and ensure that customers are satisfied with the resolution of their complaints.
24. Customer Satisfaction Score (CSAT) - Operational KPI
Customer Satisfaction Score (CSAT) is a metric used by businesses to measure the level of satisfaction that customers have with their products or services. CSAT is usually measured through customer surveys or feedback forms, where customers rate their satisfaction on a scale of 1 to 5 or a similar rating system.
The score is then calculated by dividing the number of satisfied customers by the total number of respondents, and multiplying by 100 to get a percentage score. For example, if 80 out of 100 customers rate their satisfaction at 4 or 5, the CSAT score would be 80%.
CSAT is a critical KPI for businesses as it helps them gauge how well they are meeting their customers’ expectations and identify areas for improvement. A high CSAT score indicates that customers are satisfied with the product or service and are likely to become repeat customers or recommend the business to others. On the other hand, a low CSAT score may indicate issues that need to be addressed, such as poor customer service or product quality.
25. Customer Effort Score (CES) - Operational KPI
The Customer Effort Score (CES) is an Operational KPI that measures how much effort a customer had to put in to complete a specific task, such as making a purchase or resolving a problem. It is based on the idea that the less effort a customer has to put in to achieve their desired outcome, the more likely they are to have a positive experience and remain loyal to the brand.
CES is usually measured through a survey that asks customers to rate their experience on a scale of 1 to 7, with 1 being “very difficult” and 7 being “very easy.” The resulting score provides businesses with insight into areas where they may need to streamline processes and reduce customer effort, ultimately improving customer satisfaction and loyalty.
High CES scores can indicate that customers are encountering obstacles or friction in their interactions with the company, which can lead to negative experiences and decreased loyalty. By identifying areas where customers are experiencing high levels of effort, businesses can take steps to improve the customer experience and reduce churn.
26. Average Repair Time - Operational KPI
Average Repair Time is a metric that measures the time it takes to complete repairs on products or equipment. This KPI is commonly used in industries such as manufacturing, maintenance, and service.
The calculation for Average Repair Time can be done by dividing the total time spent on repairs by the number of completed repairs within a given period. A lower average repair time is generally considered better as it indicates that equipment is being fixed quickly and reducing downtime.
Tracking this KPI can help businesses identify areas of improvement in their repair processes, such as identifying any bottlenecks or inefficiencies in the repair process, as well as ensuring that customer demands are being met promptly.
27. Average Handle Time - Operational KPI
Average Repair Time is a metric that measures the time it takes to complete repairs on products or equipment. This KPI is commonly used in industries such as manufacturing, maintenance, and service.
The calculation for Average Repair Time can be done by dividing the total time spent on repairs by the number of completed repairs within a given period. A lower average repair time is generally considered better as it indicates that equipment is being fixed quickly and reducing downtime.
Tracking this KPI can help businesses identify areas of improvement in their repair processes, such as identifying any bottlenecks or inefficiencies in the repair process, as well as ensuring that customer demands are being met promptly.
28. Manufacturing Cycle Time - Operational KPI
Manufacturing Cycle Time (MCT) is a KPI that measures the time required to produce a product from the start of the production process to its completion. The cycle time is calculated by adding up the total processing time, inspection time, wait time, and any other necessary activities involved in the production process. MCT is an essential metric for manufacturing businesses because it provides insight into the efficiency of the production process and helps identify bottlenecks or areas for improvement.
MCT is an important KPI because it directly affects the business’s ability to meet customer demands and deadlines. The faster a product can be manufactured, the more orders a business can fulfill, and the more revenue it can generate. On the other hand, a long manufacturing cycle time can result in increased production costs, decreased productivity, and lost business opportunities.
Tracking MCT helps manufacturing businesses identify opportunities for process improvement. By analyzing the data, businesses can determine which stages of the manufacturing process are taking longer than expected and identify the root cause of delays. This allows them to make informed decisions about which areas to focus on to reduce the cycle time and improve efficiency.
For example, if a business finds that a particular machine or process is causing delays, it can invest in upgrading or replacing that equipment to speed up the process. Alternatively, if a particular employee or team is responsible for slowing down the production line, the business can provide additional training or support to improve their performance.
Overall, tracking MCT is critical for manufacturing businesses to ensure that they are producing products efficiently and effectively, meeting customer demand, and maximizing profitability.

Examples of Operational KPI in Action
Case studies and examples of businesses that have successfully used Operational KPI to improve their operations and achieve their goals
Here are a few examples of companies that have used Operational KPIs to improve their operations:
Amazon: Amazon uses KPIs such as customer satisfaction rate, on-time delivery rate, and inventory turnover to improve its supply chain management. By closely monitoring these KPIs, Amazon is able to deliver goods to customers quickly and efficiently, which has helped the company become one of the world’s largest online retailers.
McDonald’s: McDonald’s uses KPIs such as average service time, order accuracy, and customer satisfaction rate to improve its customer service. By tracking these KPIs, McDonald’s is able to identify areas where it can improve its operations, such as by streamlining the ordering process or improving the quality of its food.
Toyota: Toyota uses KPIs such as defect rate, cycle time, and production efficiency to improve its manufacturing processes. By closely monitoring these KPIs, Toyota is able to identify areas where it can improve its processes, such as by reducing waste or increasing the speed of production.
Google: Google uses KPIs such as website traffic, conversion rate, and customer acquisition cost to improve its online marketing efforts. By tracking these KPIs, Google is able to identify areas where it can improve its marketing campaigns, such as by targeting specific customer segments or increasing the effectiveness of its online ads.
Airbnb: Airbnb uses KPIs such as occupancy rate, average nightly rate, and customer satisfaction rate to improve its business operations. By tracking these KPIs, Airbnb is able to optimize its pricing strategies, improve the quality of its accommodations, and provide better customer service to its users.
These examples demonstrate how Operational KPIs can be used by businesses to improve their operations, increase efficiency, and achieve their goals. By identifying the most important KPIs for their business and closely monitoring them over time, companies can make data-driven decisions that lead to long-term success.
Impact of KPIs on key areas of business performance, such as sales, customer satisfaction, and employee productivity.
Key Performance Indicators (KPIs) can have a significant impact on various areas of business performance. Here are some examples:
Sales: By tracking KPIs like customer acquisition cost (CAC), conversion rate, and average revenue per user (ARPU), businesses can identify opportunities to improve their sales processes and increase revenue. For example, a business may realize that their CAC is too high, indicating that they need to focus on improving their marketing and sales tactics to acquire customers more efficiently.
Customer satisfaction: KPIs like Net Promoter Score (NPS), customer satisfaction score (CSAT), and customer effort score (CES) provide insight into how satisfied customers are with a business’s products or services. By tracking these KPIs, businesses can identify areas where they need to improve their customer service, product quality, or overall customer experience.
Employee productivity: KPIs like employee turnover rate, absenteeism rate, and time to hire can help businesses measure their workforce’s efficiency and productivity. By tracking these KPIs, businesses can identify potential issues with employee morale, training, or workload and take steps to address these issues before they impact productivity and performance.
Overall, KPIs are essential for businesses looking to optimize their operations and achieve their objectives. By identifying the right KPIs to track and regularly monitoring their performance, businesses can make data-driven decisions and continuously improve their performance in key areas.
Related article : What Is A Key Performance Indicator (KPI)? Meaning, Templates, Examples

Templates for Tracking Operational KPI
Selection of templates and tools that businesses can use to track their Operational KPI effectively
Tracking Operational KPIs effectively requires a system that allows businesses to collect and analyze data in a meaningful way. Fortunately, there are many tools and templates available that can help businesses do this more efficiently. Here are some examples:
Excel Spreadsheet Templates: Microsoft Excel provides many pre-built templates that businesses can use to track their KPIs. These templates include a wide variety of formats and layouts, making it easy to customize them to suit specific business needs. Businesses can use Excel to create charts and graphs that visualize KPI data, making it easier to identify trends and patterns.
Online Dashboards: There are many online dashboards available that allow businesses to track their KPIs in real-time. These dashboards are often customizable and can be accessed from anywhere with an internet connection. Some popular online dashboard tools include Tableau, Google Analytics, and Klipfolio.
KPI Tracking Software: There are many KPI tracking software tools available that businesses can use to track their KPIs. These tools typically provide a more comprehensive solution than Excel spreadsheets or online dashboards, and can include features like automated data collection, data analysis, and reporting. Some popular KPI tracking software tools include Databox, Geckoboard, and Cyfe.
Balanced Scorecard: A Balanced Scorecard is a strategic planning tool that businesses can use to track their KPIs across different areas of the business. It provides a framework for identifying and tracking KPIs that are aligned with business goals and objectives. The Balanced Scorecard typically includes four perspectives: Financial, Customer, Internal Processes, and Learning and Growth.
By using templates and tools like these, businesses can ensure that they are tracking their Operational KPIs effectively and using the data to make informed decisions that drive business growth and success.
How to use these templates to set targets, monitor progress, and make informed decisions based on KPI data
Using templates for tracking operational KPIs is an effective way for businesses to set targets, monitor progress, and make informed decisions based on KPI data. Here is a brief explanation of how to use these templates:
Choose the right template: There are various templates available for tracking operational KPIs, such as Excel spreadsheets, Google Sheets, and online dashboard tools. Choose the one that best suits your business needs.
Define your KPIs: Before you start tracking your KPIs, it is essential to define them clearly. Use the list of KPIs discussed earlier in this conversation as a starting point, and choose the KPIs that are most relevant to your business goals.
Set targets: Once you have identified your KPIs, it is essential to set realistic and achievable targets. These targets should be based on your business objectives and historical performance data. For example, if your revenue growth rate for the last year was 10%, you could set a target of 12% for the coming year.
Monitor progress: Regularly track and update your KPI data on the chosen template. This will help you to monitor progress towards your targets and identify any areas that require attention.
Analyze data and make informed decisions: Use the data collected from your KPI tracking to make informed decisions. Analyze the trends and patterns in the data to identify areas of strength and weakness. Use this information to make adjustments to your business operations to improve performance.
Communicate results: Share the results of your KPI tracking with relevant stakeholders, such as managers, employees, and investors. This will help to build accountability and transparency, and encourage a culture of continuous improvement.
Overall, using templates for tracking operational KPIs is an effective way for businesses to set targets, monitor progress, and make informed decisions based on KPI data. It allows businesses to identify areas of strength and weakness and make adjustments to improve performance.

The Meaning Behind Operational KPI
Operational KPI provide businesses with valuable insights into their operations and help identify areas for improvement. By tracking KPI data over time, businesses can identify trends and patterns that help them make informed decisions and drive growth. In this section, we will discuss how businesses can use KPI data to identify areas for improvement and make strategic decisions that drive growth.
First, businesses can use KPI data to identify areas where they are falling short of their targets. For example, if a business is consistently missing its sales targets, it can look at its sales KPIs, such as conversion rate, average deal size, and lead-to-opportunity ratio, to determine where improvements need to be made. By focusing on these KPIs, the business can implement targeted strategies to improve its sales performance, such as increasing marketing spend, improving the sales process, or offering promotions to incentivize purchases.
In addition, businesses can use KPI data to identify areas of their operations that are performing well and leverage these successes to drive growth. For example, if a business is achieving a high customer satisfaction score, it can analyze its customer satisfaction KPIs, such as Net Promoter Score and Customer Effort Score, to determine what factors are contributing to this success. The business can then use this information to replicate these successful practices across other areas of its operations, such as sales or marketing, to drive growth.
Moreover, KPI data can help businesses make informed decisions about their operations and set goals for the future. By analyzing KPI data, businesses can identify opportunities for improvement, set realistic targets for improvement, and track progress towards these targets. For example, if a business is experiencing a high rate of employee turnover, it can look at its employee satisfaction and retention KPIs to determine where improvements need to be made. By setting a goal to reduce employee turnover by a certain percentage and tracking progress towards this goal, the business can ensure that it is making meaningful improvements in this area.
Why you should use Operational KPI in your business with DoerHRM software?
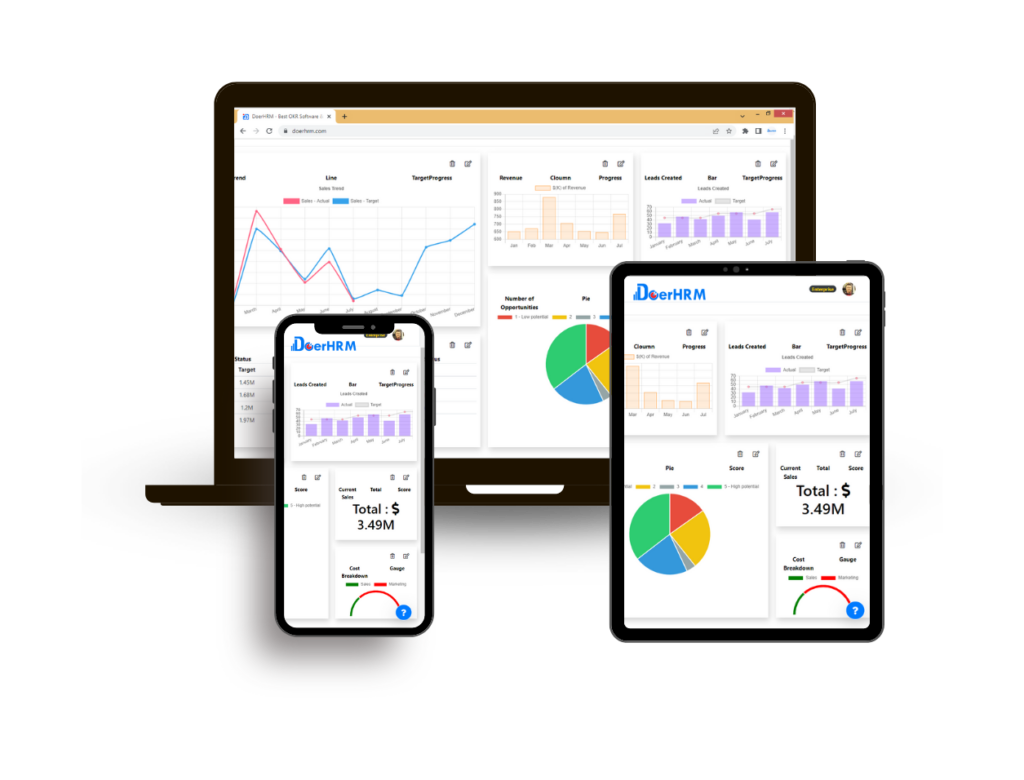
DoerHRM – As a business owner, you have a lot on your plate. Managing your operations and ensuring that everything is running smoothly can be challenging, especially when you don’t have the right tools and resources at your disposal. That’s where operational KPI come in.
Operational KPI, or key performance indicators, provide you with a clear and measurable way to track your business performance. By monitoring these metrics, you can identify areas of improvement and make informed decisions that drive growth and success.
One of the best ways to track your operational KPIs is by using an HR software solution like DoerHRM. This powerful tool provides you with a comprehensive suite of features that can help you streamline your operations and improve your business performance.
One of the key benefits of using DoerHRM to track your operational KPIs is that it allows you to set and monitor goals in real-time. You can easily define your KPIs, set targets, and track your progress over time. This can help you stay on top of your business performance and make informed decisions that drive growth.
Another benefit of using DoerHRM for your operational KPIs is that it provides you with actionable insights into your business performance. With detailed reports and analytics, you can identify trends, patterns, and areas of improvement. This can help you optimize your operations and make strategic decisions that drive growth.
DoerHRM also provides you with a range of tools and resources to help you improve your operations and achieve your goals. From performance management to employee engagement and feedback, DoerHRM has everything you need to drive business success.
Conclusion
In conclusion, Operational KPI play a crucial role in measuring and improving the performance of a business. By tracking and analyzing these key metrics, businesses can gain valuable insights into their operations and identify areas for improvement. They can also set targets and monitor progress towards their goals, as well as make informed decisions based on the KPI data.
It is essential for businesses to use templates and tools to track their Operational KPI effectively. These templates and tools help businesses to collect and analyze the data easily, providing them with the information they need to make informed decisions. Furthermore, businesses can use the insights gained from tracking their KPIs to identify areas for improvement and make strategic decisions that drive growth.
In today’s competitive market, businesses cannot afford to ignore the importance of Operational KPI. By implementing these metrics and analyzing their data regularly, businesses can stay ahead of the curve and achieve their goals. Therefore, it is essential for businesses to start tracking their Operational KPI and use the insights gained to make informed decisions and achieve their goals.