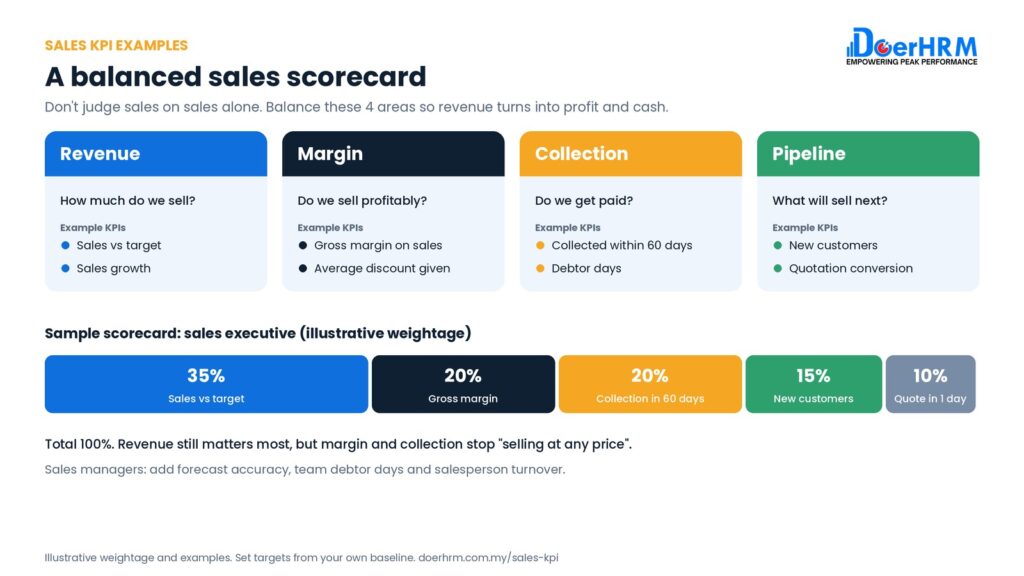
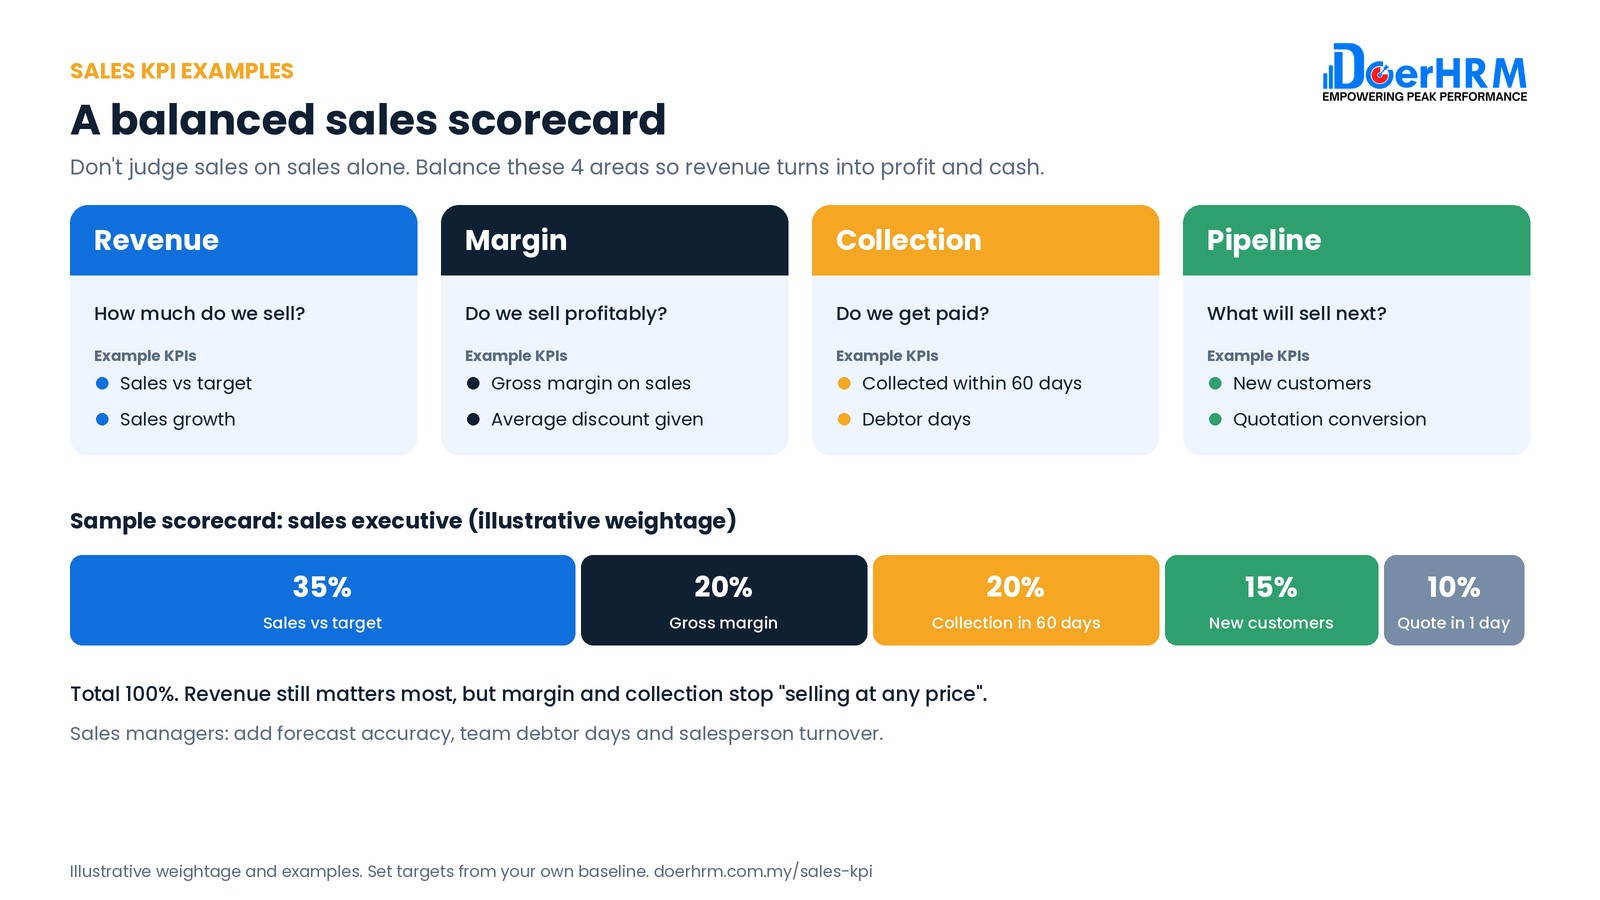
Good sales KPIs measure more than sales. The best sales scorecards balance revenue (how much you sell), margin (how profitably you sell), collection (whether you get paid) and pipeline (what will sell next). Below are 28 sales KPI examples with formulas, plus sample scorecards for a sales executive and a sales manager.
Key takeaways
- Don’t give sales staff only one KPI. “Sales vs target” alone rewards discounting and bad debt.
- A balanced sales scorecard has 4–6 KPIs: revenue, margin, collection, new customers and one pipeline KPI.
- Sales executives need activity and pipeline KPIs; sales managers need team, forecast and margin KPIs.
- Every KPI needs a formula, baseline, target, owner and review frequency.
- Download our free KPI templates to build your scorecard in Excel.
By Ng Shone Fone, Founder and CEO of DoerHRM, with 30 years in business.
What is a sales KPI?
A sales KPI is a measurable target that shows how well a salesperson or sales team contributes to company goals. Examples: sales vs target, gross margin on sales and debtor days.
Sales KPIs sit inside the wider KPI performance management process: company goals → sales department KPIs → each salesperson’s KPIs.
What is a good KPI for sales staff?
A good KPI for sales staff is one they can influence, that links to company profit, and that is measured every month, such as monthly sales vs target, gross margin on their sales, and invoices collected within 60 days.
In our workshops, we often see this problem: “Sales hit target, but profit fell.” The salesperson met the revenue KPI by giving bigger discounts and longer credit terms. Adding margin and collection KPIs fixes this.
28 sales KPI examples (with formulas)
Revenue KPIs
| # | KPI | Formula |
|---|---|---|
| 1 | Sales vs target | Actual sales ÷ sales target × 100% |
| 2 | Sales growth | (This period − same period last year) ÷ last year × 100% |
| 3 | Average order value | Total sales ÷ number of orders |
| 4 | Sales from new products | Sales of new products ÷ total sales × 100% |
| 5 | Repeat sales | Sales from existing customers ÷ total sales × 100% |
| 6 | Sales per salesperson | Total team sales ÷ number of salespeople |
| 7 | Key account sales growth | Growth in sales to the top 20 accounts |
Profitability and cash KPIs
| # | KPI | Formula |
|---|---|---|
| 8 | Gross margin on sales | (Sales − cost of goods sold) ÷ sales × 100% |
| 9 | Average discount given | Total discounts ÷ gross sales × 100% |
| 10 | Debtor days | Trade receivables ÷ credit sales × days in period |
| 11 | Collection within terms | Invoices paid within terms ÷ total invoices × 100% |
| 12 | Bad debt rate | Bad debts written off ÷ credit sales × 100% |
| 13 | Price realisation | Actual selling price ÷ list price × 100% |
Pipeline and activity KPIs
| # | KPI | Formula |
|---|---|---|
| 14 | Quotations sent | Number of quotations sent per month |
| 15 | Quotation-to-order conversion | Quotations won ÷ quotations sent × 100% |
| 16 | Quotation turnaround time | Average days from enquiry to quotation |
| 17 | Pipeline value | Total value of open opportunities |
| 18 | Pipeline coverage | Pipeline value ÷ next quarter’s target |
| 19 | Customer visits or meetings | Number of qualified visits per month |
| 20 | Sales cycle length | Average days from first contact to order |
Customer KPIs
| # | KPI | Formula |
|---|---|---|
| 21 | New customers | Number of new accounts opened |
| 22 | Customer retention | Customers who bought again ÷ customers at start × 100% |
| 23 | Customer satisfaction | Average survey score (e.g. out of 5) |
| 24 | Complaints per 100 orders | Complaints ÷ orders × 100 |
| 25 | Share of wallet (key accounts) | Our sales ÷ customer’s total spend on the category |
Sales management KPIs
| # | KPI | Formula |
|---|---|---|
| 26 | Team sales vs target | Team actual ÷ team target × 100% |
| 27 | Forecast accuracy | 1 − (difference between forecast and actual ÷ actual) |
| 28 | Salesperson turnover | Salespeople who left ÷ average number of salespeople × 100% |
Sample scorecard: sales executive
An illustrative scorecard for a B2B sales executive. Weightages and targets are examples only. If you pay bonus on KPI scores, see how to calculate performance bonus.
| KPI | Weightage | Example target | Why it’s there |
|---|---|---|---|
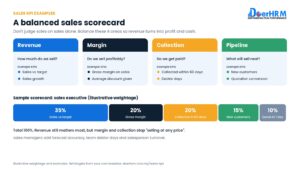
| Sales vs target | 35% | 100% of RM50,000 a month | Revenue |
| Gross margin on sales | 20% | 25% | Stops “selling at any price” |
| Collection within 60 days | 20% | 90% | Gets the company paid |
| New customers | 15% | 4 a month | Future growth |
| Quotation turnaround | 10% | Within 1 working day | Customer experience |
| Total | 100% |
Sample scorecard: sales manager
| KPI | Weightage | Example target |
|---|---|---|
| Team sales vs target | 30% | 100% |
| Team gross margin | 20% | 24% |
| Debtor days (team) | 15% | 60 days or less |
| Forecast accuracy | 15% | 90% |
| Key account sales growth | 10% | 10% a year |
| Salesperson turnover | 10% | 15% or less a year |
| Total | 100% |
Targets must come from your own baseline and company goals. See our employee KPI examples for other roles.
How do you set sales targets fairly?
Start from the company’s sales budget, split it by territory or account based on past sales and potential, then agree targets with each salesperson.
- Start from the company budget for the year.
- Use the baseline: last year’s sales by territory or account.
- Adjust for potential: new products, new customers, lost accounts.
- Agree, don’t impose: discuss the target with each salesperson before it’s final.
- Review monthly and act early when someone falls behind.
Common sales KPI mistakes
- Only one KPI (sales). Encourages discounts and bad debt.
- Too many activity KPIs. Counting calls rewards being busy, not selling.
- Targets with no baseline. Leads to targets that are either impossible or too easy.
- Paying commission on sales, not on collected sales. Creates cash-flow problems.
- Reviewing only at year-end. Too late to fix a weak quarter.
Frequently asked questions
What are the KPIs for a sales executive? Common KPIs for a sales executive are sales vs target, gross margin on their sales, collection within credit terms, new customers and quotation turnaround time. Four to six KPIs is usually enough.
What are the KPIs for a sales manager? Sales managers are usually measured on team sales vs target, team gross margin, debtor days, forecast accuracy, key account growth and salesperson turnover.
What is a good sales KPI? A good sales KPI is one the salesperson can influence, that links to company profit or cash, and that is measured every month against a clear target.
How many KPIs should a salesperson have? Usually 4 to 6. Fewer than 3 encourages short-term behaviour; more than 7 spreads attention too thin.
Should sales KPIs include collection? Yes, especially in B2B. A sale that is never paid for is not a real sale. Including collection or debtor days protects cash flow.
How often should sales KPIs be reviewed? Monthly for results such as sales and margin, and weekly for pipeline and activity KPIs.
Conclusion
The best sales scorecards balance revenue, margin, collection and pipeline. Choose 4–6 KPIs from the 28 examples above, set targets from your baseline, and review them every month.
Want your sales managers to build balanced scorecards for their own teams? Request a customised KPI workshop proposal.
Ng Shone Fone is the Founder and CEO of DoerHRM and Group CEO of Obsnap. With 30 years in business, he helps Malaysian companies set KPIs and OKRs that drive results.