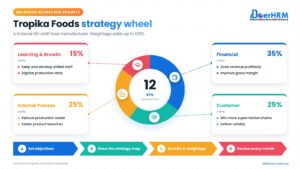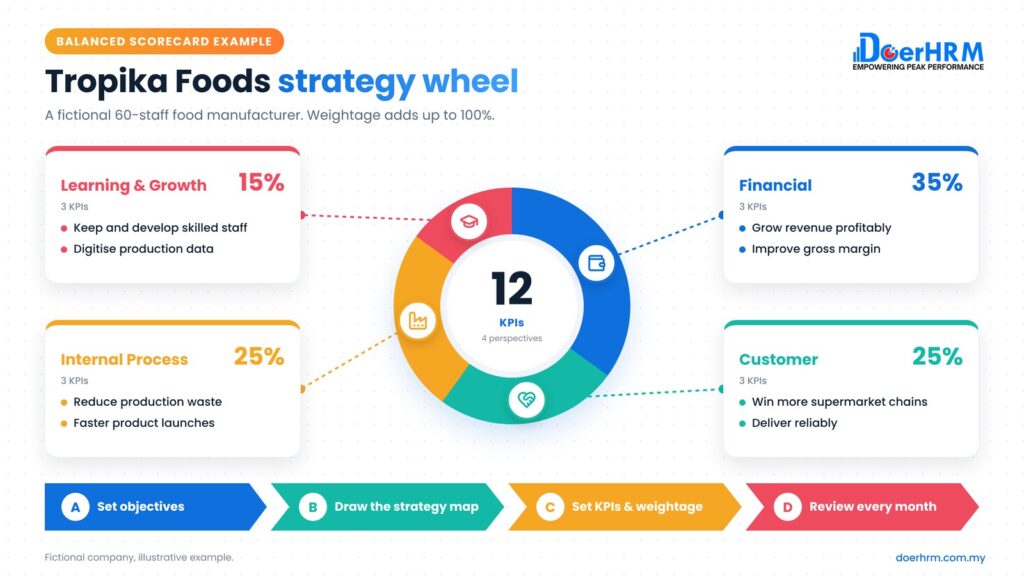
A balanced scorecard measures a company’s strategy from 4 perspectives: Financial, Customer, Internal Process, and Learning & Growth. Below is a complete example for a fictional 60-staff Malaysian food manufacturer, with 12 KPIs, targets, weightage and a strategy map you can adapt.
Key takeaways
- The 4 perspectives are Financial, Customer, Internal Process, and Learning & Growth (People).
- Each perspective has 2–4 objectives, and each objective has 1–2 KPIs. About 12 KPIs is enough for an SME.
- Objectives link from the bottom up: better people → better processes → happier customers → better financials.
- Weightage shows what matters most; the total must be 100%.
- Download the free Excel version of this example.
By Ng Shone Fone, Founder and CEO of DoerHRM, with 30 years in business.
What is a balanced scorecard?
A balanced scorecard is a strategy tool that turns a company’s goals into objectives and KPIs across 4 perspectives, so management doesn’t look at financial results alone.
The method was developed by Robert Kaplan and David Norton and published in Harvard Business Review in 1992. The idea: financial results are lagging indicators; customer, process and people results show what will happen next. It is the first step of KPI performance management: company scorecard first, then department and individual KPIs.
What are the 4 perspectives of a balanced scorecard?
The 4 perspectives are Financial, Customer, Internal Process, and Learning & Growth. Each asks a different question about the strategy.
| Perspective | Question it answers | Typical KPIs |
|---|---|---|
| Financial | Are we growing profitably? | Revenue growth, gross margin, cash flow |
| Customer | Are customers choosing and staying with us? | Retention, satisfaction, on-time delivery |
| Internal Process | Which processes must we be excellent at? | Defect rate, cycle time, cost per unit |
| Learning & Growth (People) | Do our people and systems have what they need? | Training hours, staff turnover, key roles filled |
Balanced scorecard example: the company
“Tropika Foods Sdn Bhd” (fictional) is a 60-staff sauce and paste manufacturer in Penang. It sells to supermarkets and food distributors.
Its strategy for 2027: grow sales to supermarket chains, raise margin by reducing waste, and keep its best production staff.
Step 1: Set objectives for each perspective
| Perspective | Objectives |
|---|---|
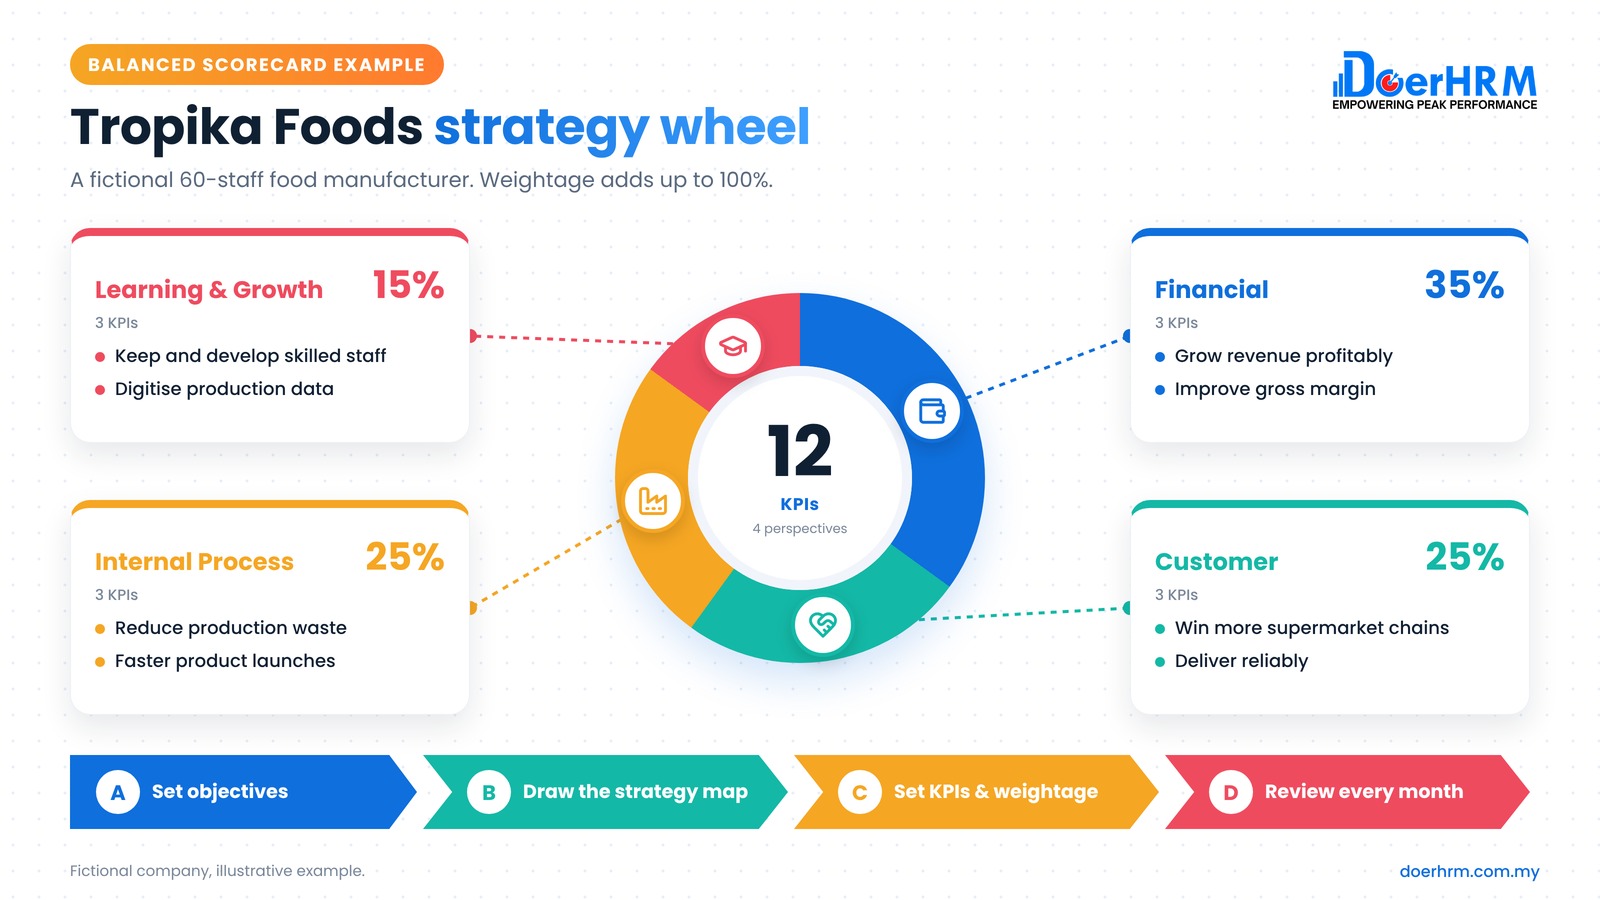
| Financial | F1 Grow revenue profitably · F2 Improve gross margin |
| Customer | C1 Win more supermarket chains · C2 Deliver reliably |
| Internal Process | P1 Reduce production waste · P2 Speed up new product launches |
| Learning & Growth | L1 Keep and develop skilled staff · L2 Digitise production data |
Step 2: Draw the strategy map (cause and effect)
A strategy map shows how objectives in the lower perspectives drive results in the higher ones.
- L1 Keep skilled staff + L2 Digitise production data → enable →
- P1 Reduce waste and P2 Faster launches → which lead to →
- C1 Win supermarket chains and C2 Deliver reliably → which drive →
- F1 Grow revenue profitably and F2 Improve gross margin
If a financial result is weak, the map tells you where to look lower down.
Step 3: Choose KPIs, targets and weightage
The completed scorecard below has 12 KPIs. Weightage adds up to 100%. All numbers are illustrative.
| Perspective (weight) | Objective | KPI | Baseline | Target 2027 | KPI weight |
|---|---|---|---|---|---|
| Financial (35%) | F1 Grow revenue profitably | Revenue growth | 6% | 12% | 15% |
| F1 | Revenue from supermarket chains | RM4.0m | RM5.5m | 10% | |
| F2 Improve gross margin | Gross profit margin | 24% | 27% | 10% | |
| Customer (25%) | C1 Win supermarket chains | New supermarket chains signed | 1 | 3 | 10% |
| C2 Deliver reliably | On-time, in-full delivery | 91% | 97% | 10% | |
| C2 | Customer complaints per 100 orders | 2.5 | 1.0 | 5% | |
| Internal Process (25%) | P1 Reduce waste | Production waste (% of raw material) | 6% | 3.5% | 10% |
| P1 | Defect rate | 1.8% | 1.0% | 5% | |
| P2 Faster launches | Days from recipe approval to launch | 120 | 75 | 10% | |
| Learning & Growth (15%) | L1 Keep skilled staff | Production staff turnover | 22% | 12% | 5% |
| L1 | Training hours per employee | 8 | 24 | 5% | |
| L2 Digitise production data | Production lines with daily digital reporting | 1 of 4 | 4 of 4 | 5% | |
| Total | 100% |
Why these weights? Financial results matter most to the owners, but customer and process objectives carry half the weight, because they drive next year’s financials.
Download the free Excel version of this example
All 12 KPIs, weightage, automatic scoring, a strategy map and an initiatives sheet. Fill in the yellow cells with your own objectives and targets.
Step 4: Add initiatives
Each objective needs at least one initiative, the project that will move the KPI.
| Objective | Initiative | Owner | Timing |
|---|---|---|---|
| C1 Win supermarket chains | Halal-certified private-label range for supermarkets | Sales Director | Q1–Q2 |
| P1 Reduce waste | Daily waste tracking on every line | Production Manager | Q1 |
| P2 Faster launches | Stage-gate launch process | R&D Lead | Q2 |
| L1 Keep skilled staff | Skills matrix and operator career path | HR Manager | Q1–Q3 |
Step 5: Cascade to departments and staff
The company scorecard becomes department scorecards, then individual KPIs. For example, “Production waste” becomes the Production Manager’s KPI, and “waste per shift” becomes each supervisor’s KPI. See our goal-setting guide for how to cascade goals.
Step 6: Review monthly and quarterly
- Monthly: update actuals; discuss KPIs that are behind; agree one action each.
- Quarterly: review initiatives and the strategy map. Is the cause-and-effect logic working?
- Yearly: reset objectives and targets.
A balanced scorecard can be run in Excel for one company scorecard. When you cascade it to many departments and staff, balanced scorecard software saves a lot of manual work. DoerHRM shows the same scorecard as a table, a cause-and-effect map, a tree or a Gantt view.
Common balanced scorecard mistakes
- Too many KPIs. 40 KPIs is a dashboard, not a strategy.
- No cause-and-effect logic. If the people and process KPIs don’t drive the customer and financial ones, the scorecard is just four lists.
- All lagging indicators. Include leading KPIs such as waste, delivery and training.
- No initiatives. KPIs show where you are; initiatives get you there.
- Built once, never reviewed. Monthly reviews keep it alive.
Frequently asked questions
What are the 4 perspectives of a balanced scorecard? Financial, Customer, Internal Process, and Learning & Growth. Many companies rename the last one “People” or “Learning & Growth”.
How many KPIs should a balanced scorecard have? For an SME, about 10 to 16 KPIs at company level, with 2 to 4 per perspective, is enough. Department scorecards are usually smaller.
What is a strategy map? A strategy map is a one-page diagram showing how objectives in the four perspectives cause each other, from people and processes up to customers and financial results.
Is the balanced scorecard still relevant in 2026? Yes. Many companies combine it with OKRs (see OKR vs KPI): the balanced scorecard for the yearly strategy and KPIs, and OKRs for quarterly priorities.
Can I make a balanced scorecard in Excel? Yes. Excel works well for one company scorecard. Download our free example above. Cascading to many departments and staff is easier with software.
What is the difference between a balanced scorecard and a KPI scorecard? A balanced scorecard organises objectives and KPIs by the 4 perspectives to reflect strategy. A KPI scorecard is any list of KPIs for a team or person, often cascaded from the balanced scorecard.
Conclusion
A balanced scorecard turns strategy into 4 perspectives, about 12 KPIs, clear weightage and initiatives. Use the Tropika Foods example as a starting point: set objectives, draw the strategy map, choose KPIs and targets, then review monthly.
Want your management team to build a balanced scorecard for your company? Discuss your strategy alignment with us in a KPI, OKR and Balanced Scorecard workshop.
Ng Shone Fone is the Founder and CEO of DoerHRM and Group CEO of Obsnap. With 30 years in business, he helps Malaysian companies set KPIs and OKRs that drive results.